


The bullish wave that began to form in late February appears to have stalled out, and XRP’s recent attempt at recovery is losing structure.
The asset was able to create a series of higher lows and momentarily move closer to the $1.50 area, but there isn’t any follow-through. The price is returning to hesitancy just below a significant resistance cluster rather than continuing. The rejection close to the short-term resistance trendline and the inability to maintain movement above it are the most telling indicators.
Although XRP broke out of a local ascending structure, it did not develop into a long-term trend. Instead of expansion, what you are currently witnessing is a flattening of momentum. Instead of committing, the market tested upside liquidity.


Technically speaking, XRP is still below its main moving averages, such as the 100 and 200 EMA, both of which are still declining. It defines the larger trend, so it is not just a small detail. Any bullish move is, by definition, a counter-trend as long as the price remains below those levels, and they usually fail unless they are backed by significant volume and persistence.
Another flaw is the volume itself. The recent push higher did not result in any notable expansion, indicating that buyers were not sufficiently aggressive to flip market structure. Without that involvement, rallies are susceptible to swift reversals, which is precisely what appears to be occurring right now.
You Might Also Like

The rounding bottom formation, which appeared promising, could now be invalidated. The entire recovery attempt will restart if XRP begins to lose the higher-low structure around $1.35-$1.38, and the market will probably return to consolidation or even continue the downtrend.
Although the likelihood is changing, there is still a small window of opportunity for XRP to stabilize and try another push. The bullish wave exhausted itself before regaining crucial resistance, so it did not enter a breakout phase.
Bitcoin is not yet ready
With the $80,000 mark getting farther and farther out of reach, Bitcoin’s most recent price action is beginning to resemble a rejection phase rather than a recovery attempt.
Following a brief surge toward the mid-$70,000s, Bitcoin was unable to maintain its momentum and is currently stagnating just below a declining resistance trendline that has been capping the price for months.
The structure is obvious: Bitcoin is trading inside a tightening formation, but it keeps failing at lower highs rather than creating pressure for a breakout. The notion that sellers continue to control the larger trend is reinforced by the fact that every attempt to recover higher levels is sold into.
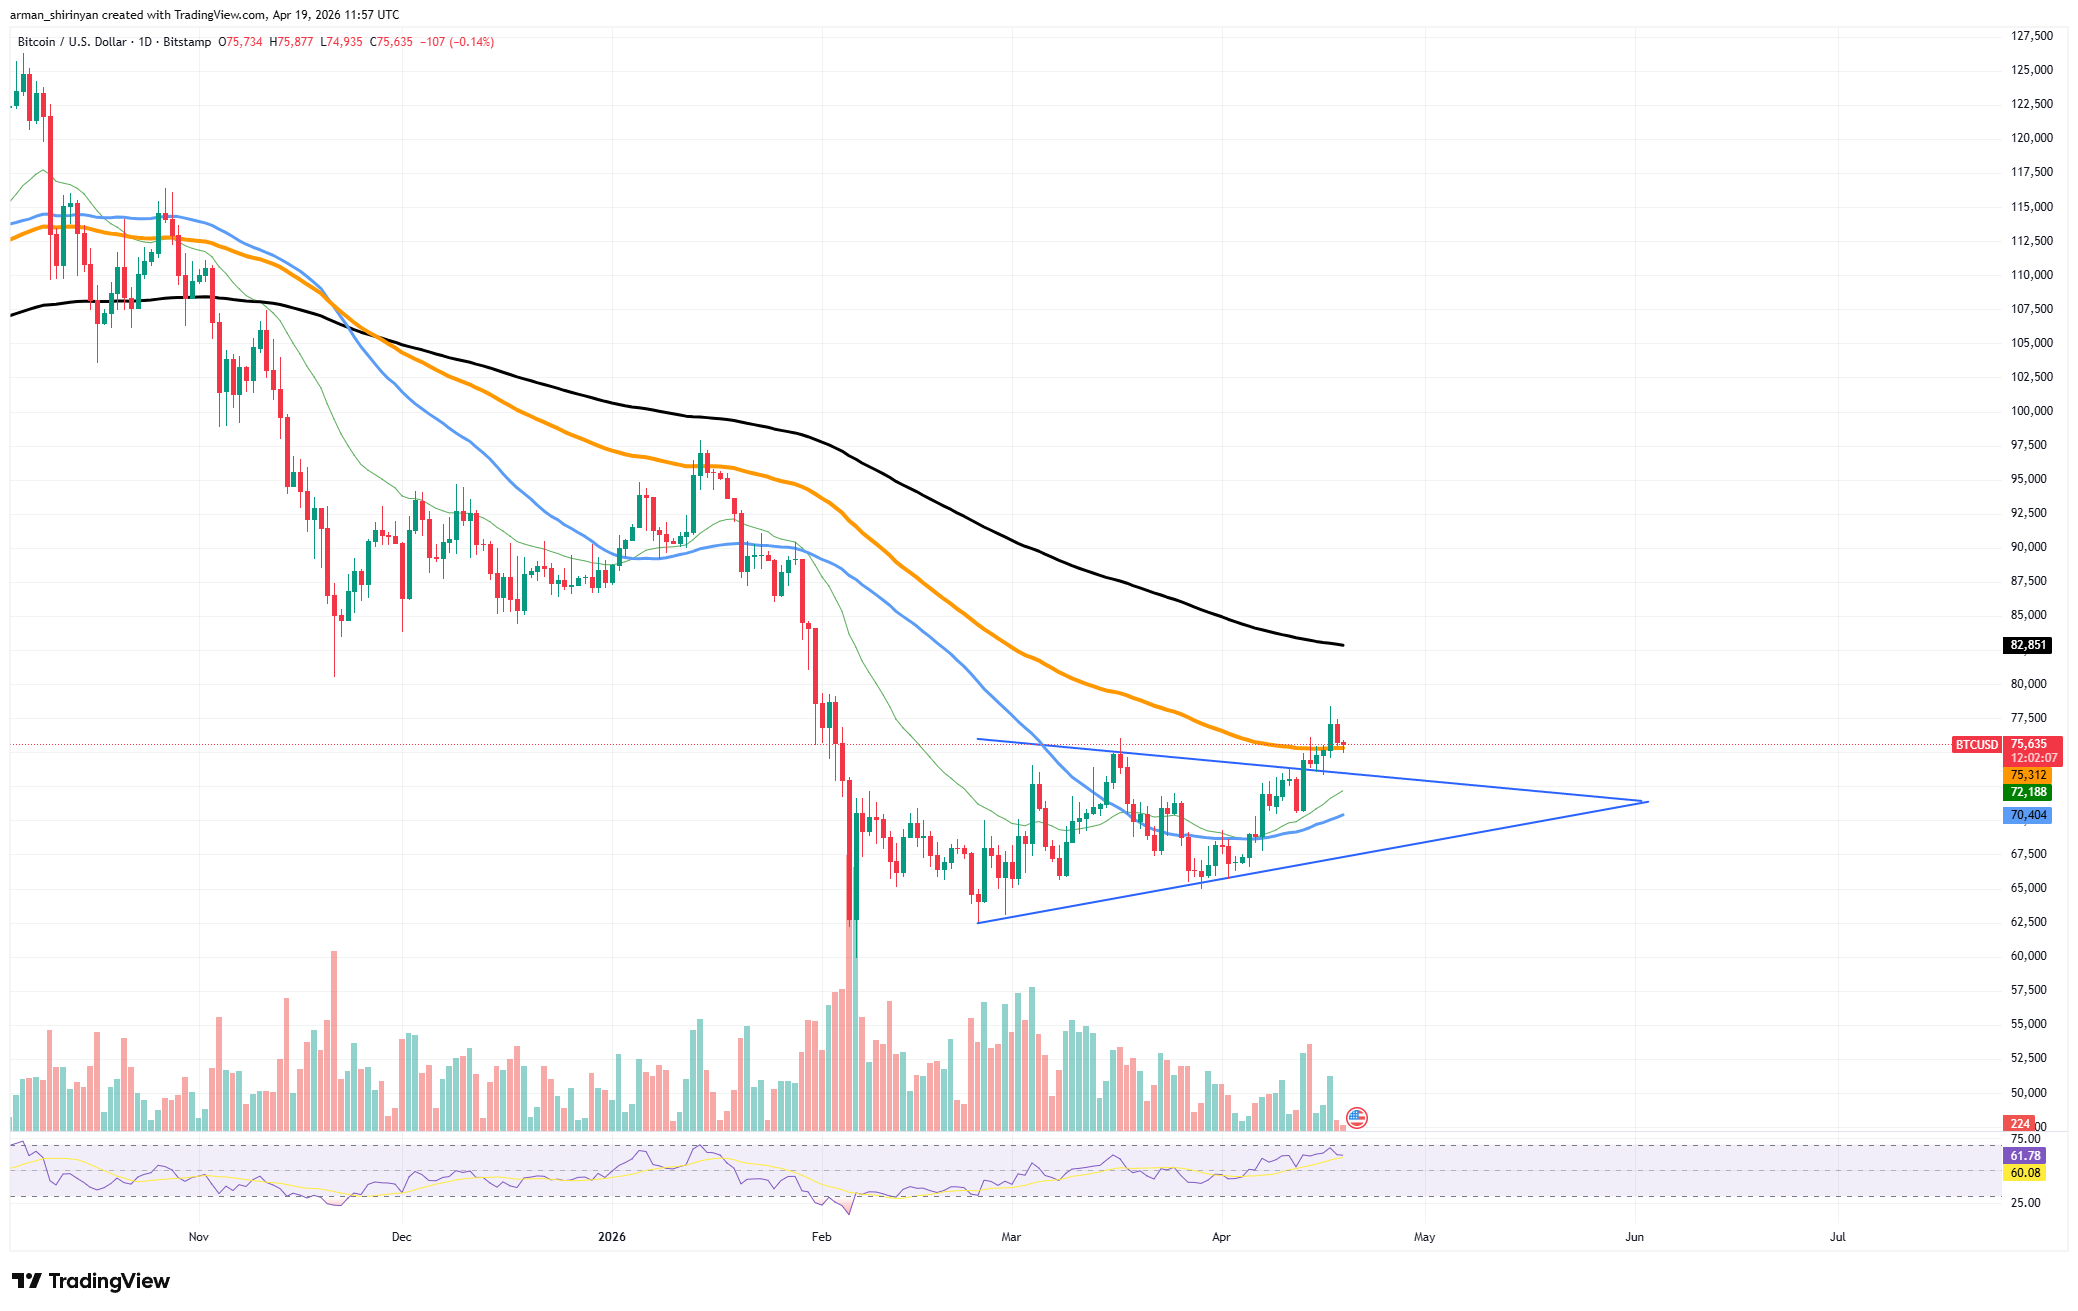
The inability of Bitcoin to clearly break and hold above the 100 EMA is a serious warning sign for bulls, as it continues to be a significant barrier overhead.
As far as trends go, nothing has changed. Both the 100 and 200 EMAs, which slope downward, are still locked above the asset. Instead of a reversal, that alignment indicates a continuation bias.
The recent recovery from the $60,000-$65,000 range offered some short-term respite, but it has not resulted in a structural change. Nor does volume lend credence to a breakout story. Although there was some expansion during the initial rebound, there hasn’t been consistent follow-through volume, indicating that the move does not have strong institutional support. In the short term, recovering $80,000 becomes increasingly implausible without that.
Expectations of a return to $80,000 should be lowered unless Bitcoin can confidently reclaim the 100 EMA and break above the declining resistance.
For the time being, BTC is essentially saying goodbye to that level. The likelihood that the market will turn its attention to consolidation or another downward leg increases with the length of time it remains below resistance.
Shiba Inu’s worrisome signal
At a time when price action is still structurally weak, Shiba Inu is displaying a well-known but unsettling signal: increasing exchange netflows.
More than 10 billion SHIB are reportedly shifting toward centralized exchanges, according to the most recent data. This trend usually corresponds with rising sell-side pressure rather than accumulation.
In terms of price, SHIB remains trapped in a wider downward trend. The 100 and 200 EMAs serve as dynamic resistance overhead as the asset continues to trade below its major moving averages. The market has entered a low-volatility consolidation phase close to local lows after recent attempts to push higher were swiftly capped.
This type of compression frequently precedes a more significant move, but the likelihood of a downward continuation is skewed with increasing exchange inflows.
You Might Also Like

Exchange netflows are important because they reveal intent. Tokens that leave exchanges typically indicate long-term holding behavior. Moving on to exchanges, particularly in large quantities, suggests getting ready to sell or reposition. Reaching the 10 billion mark is a significant liquidity event that expands the market’s supply, not just noise.
The weak demand absorption is what makes this configuration more vulnerable. During recent bounces, volume has not significantly increased, indicating that buyers are not intervening forcefully enough to offset incoming supply. Even mild selling pressure can drive down the price in the absence of that demand.
This is not a time for investors to believe that the bottom is in. Although the sideways movement may appear stable, distribution rather than accumulation is more likely.