


With price action and momentum indicators indicating a near total lack of buying interest, Dogecoin has entered one of its weakest technical phases of 2026. Bulls have little indication that a significant recovery is in progress because the token’s market momentum has essentially plateaued, even though it is clearly far from a literal price of zero.
Dogecoin is barely recovering
DOGE is only slightly above its recent local lows, trading at $0.069 on the daily chart. More significantly, the asset keeps printing a string of lower highs and lower lows, demonstrating that sellers are still in complete control. Since June, every attempt at a recovery has been sold into, making it impossible for Dogecoin to build a long-lasting bullish structure. Technically, the situation is still very pessimistic.
Every significant moving average, including the 20-day, 50-day, 100-day, and 200-day averages, is traded below by DOGE. The longer-term averages are still sloping downward, suggesting that the main trend has not altered, but the 20-day moving average is starting to flatten as the price consolidates.
Buyers still have a lot of work ahead of them, as evidenced by the difference between the current price and the 100-day moving average near $0.083. The declining 200-day moving average is located above that at $0.099, which is almost 40% higher than current levels.
Any upward movement will probably be seen as a relief rally rather than the start of a new trend until those resistance zones begin to close.
A little above oversold territory but still well below the neutral 50 mark, the RSI is currently trading around 40. This indicates that although the market’s bearish momentum has somewhat subsided, buyers are still reluctant to invest enough to tip the scales.
The declining participation indicates that many market participants are merely waiting for a stronger catalyst before re-entering the market, with neither bulls nor bears actively constructing new positions.
The recent lows around $0.068 continue to be the immediate support. If that level were lost, new annual lows would be revealed and the current downward trend would be strengthened. The first minor win for buyers would be regaining the 20-day moving average, but the more significant obstacle is still the 50-day average at $0.074.
XRP’s momentum isn’t recovering
On the daily chart, XRP is still under pressure, but recent price movement indicates that the bearish momentum is starting to lessen. As the asset continues to trade in an ever-narrower range above the psychologically significant $1 level, sellers seem to be losing confidence, even though buyers have not yet regained control.
The overall trend is clearly bearish because every rally has stopped below the major moving averages. The recent consolidation, however, differs from the forceful selloffs that were observed earlier in the year. Rather than experiencing sharp drops, XRP has entered a phase of low volatility in which neither side can make a decisive move.
Technically speaking, XRP is still below every significant moving average. The 50-day moving average is still declining around $1.09, while the 20-day moving average has leveled off slightly above the current price.
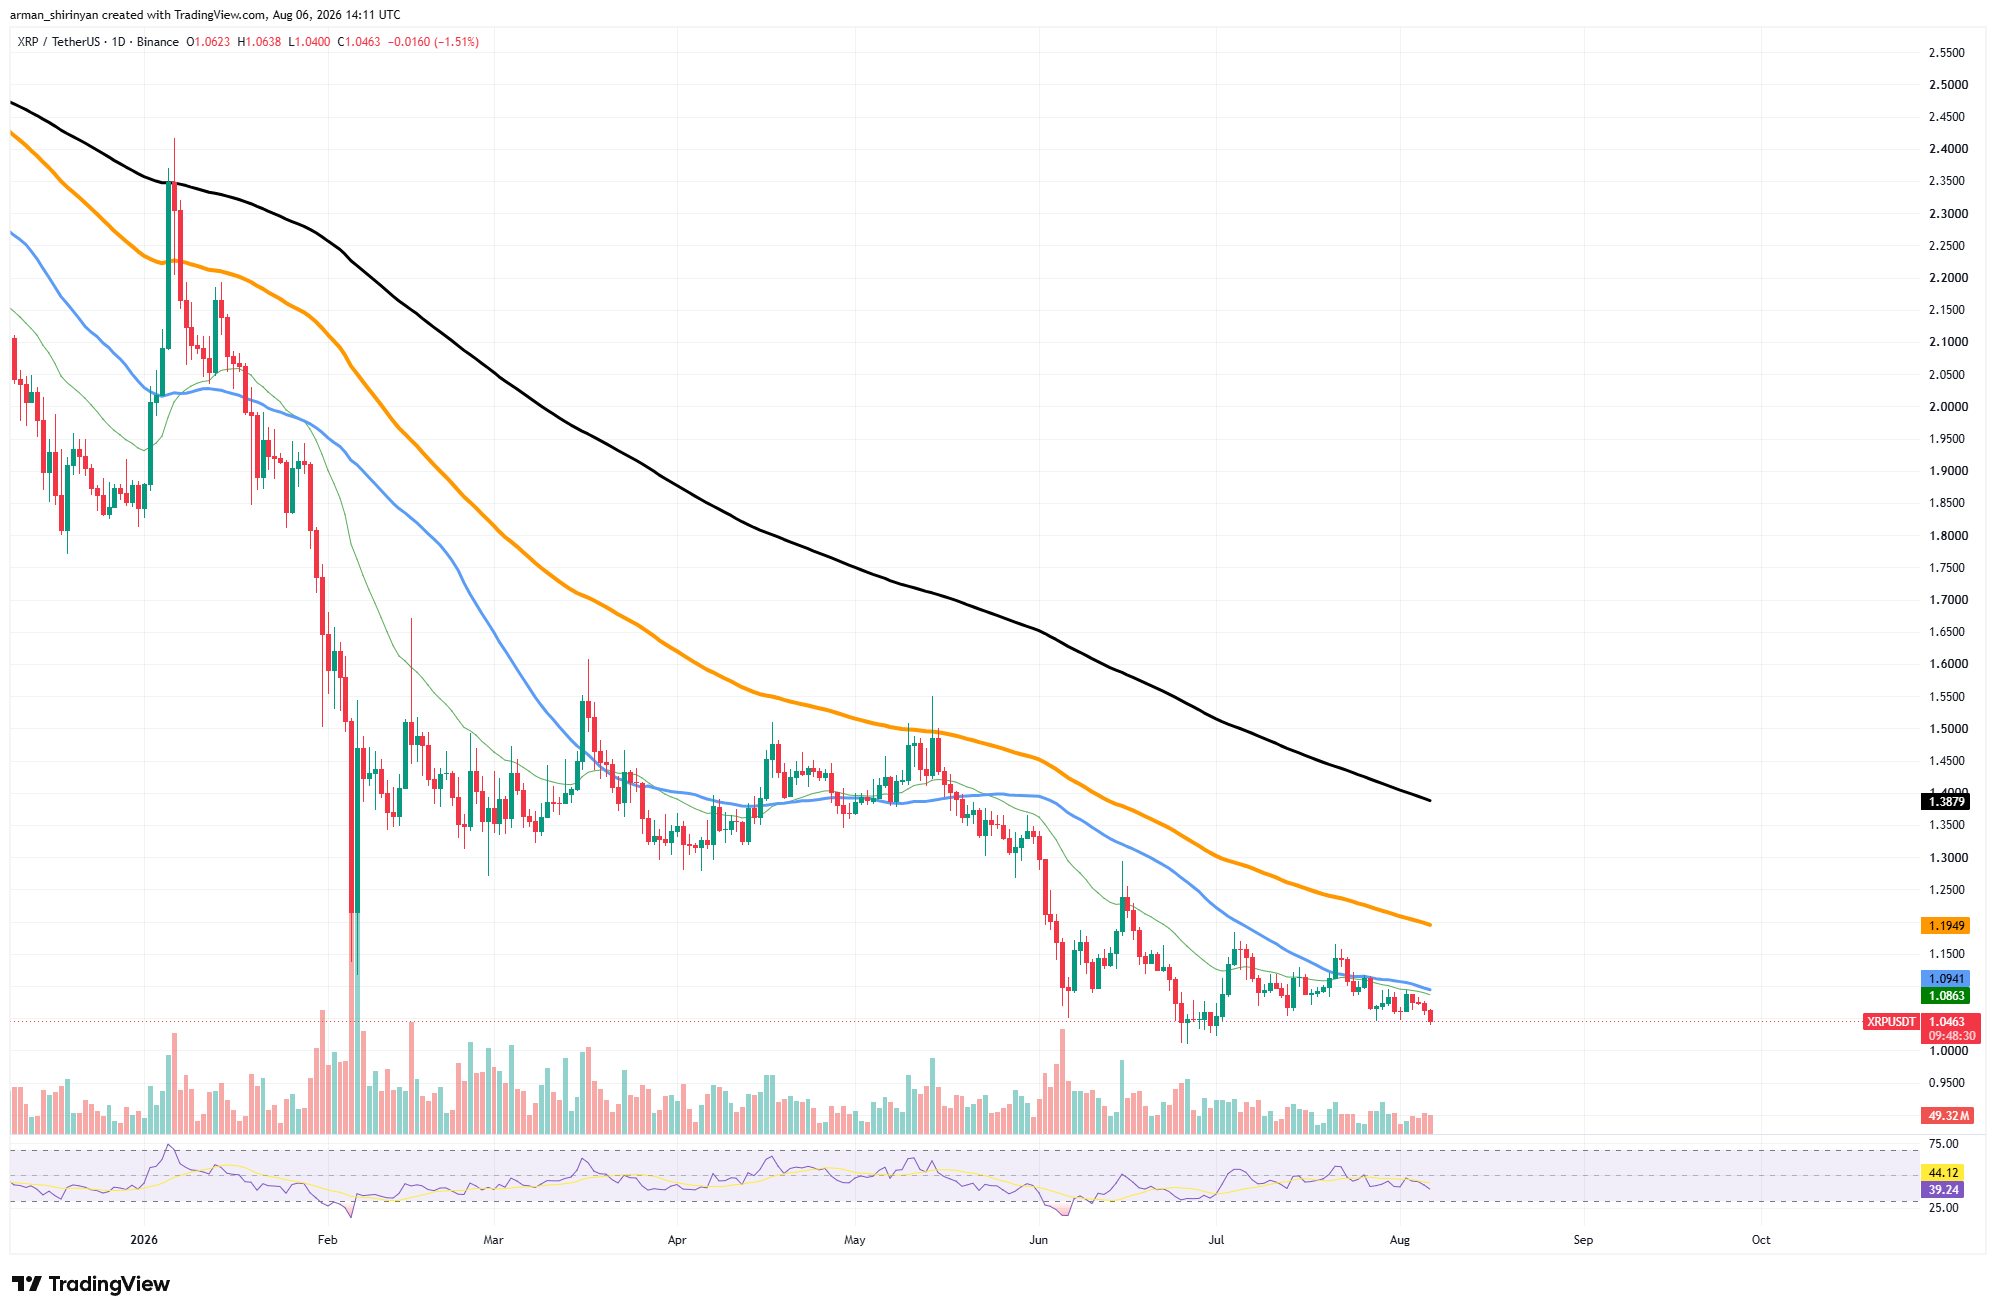
Bulls still have a long way to go before the long-term trend shifts, as evidenced by the 100-day moving average near $1.20 and the 200-day moving average around $1.39 being well out of reach.
The sellers’ lack of follow-through is one positive sign despite that bearish structure. The price has tested the $1.03–$1.05 range several times without triggering another wave of vigorous liquidation. Rather, candles have gotten smaller over time, indicating that selling pressure is gradually being absorbed. This is supported by momentum indicators.
The RSI is not getting close to oversold territory, but it is still below the neutral level at about 40. Even though it has not yet turned into a bullish trend, this shows that bearish momentum has significantly diminished.
Another sign that market participants are waiting for a catalyst rather than actively pursuing short positions is the decline in trading volume over the past few weeks. Even though the direction remains unclear until XRP leaves its current range, this kind of compression frequently precedes a larger move.
Regaining the 20-day and 50-day moving averages would be the first sign that momentum is shifting for bulls. Until then, buyers continue to be drawn to the immediate support, which is still close to the psychologically significant $1 level.
Bitcoin’s momentum is growing
After spending several weeks consolidating above its June lows, Bitcoin is beginning to show signs of regaining bullish momentum. The most recent price action indicates that buyers are gradually regaining control as the market continues to defend the $64,000 support area, even though the overall trend has not yet completely reversed.
In contrast to the steep drops observed earlier this summer, the daily chart indicates a significant change in market structure. Throughout July and the first part of August, Bitcoin has set a series of higher lows rather than new lows, suggesting that demand is starting to withstand selling pressure.
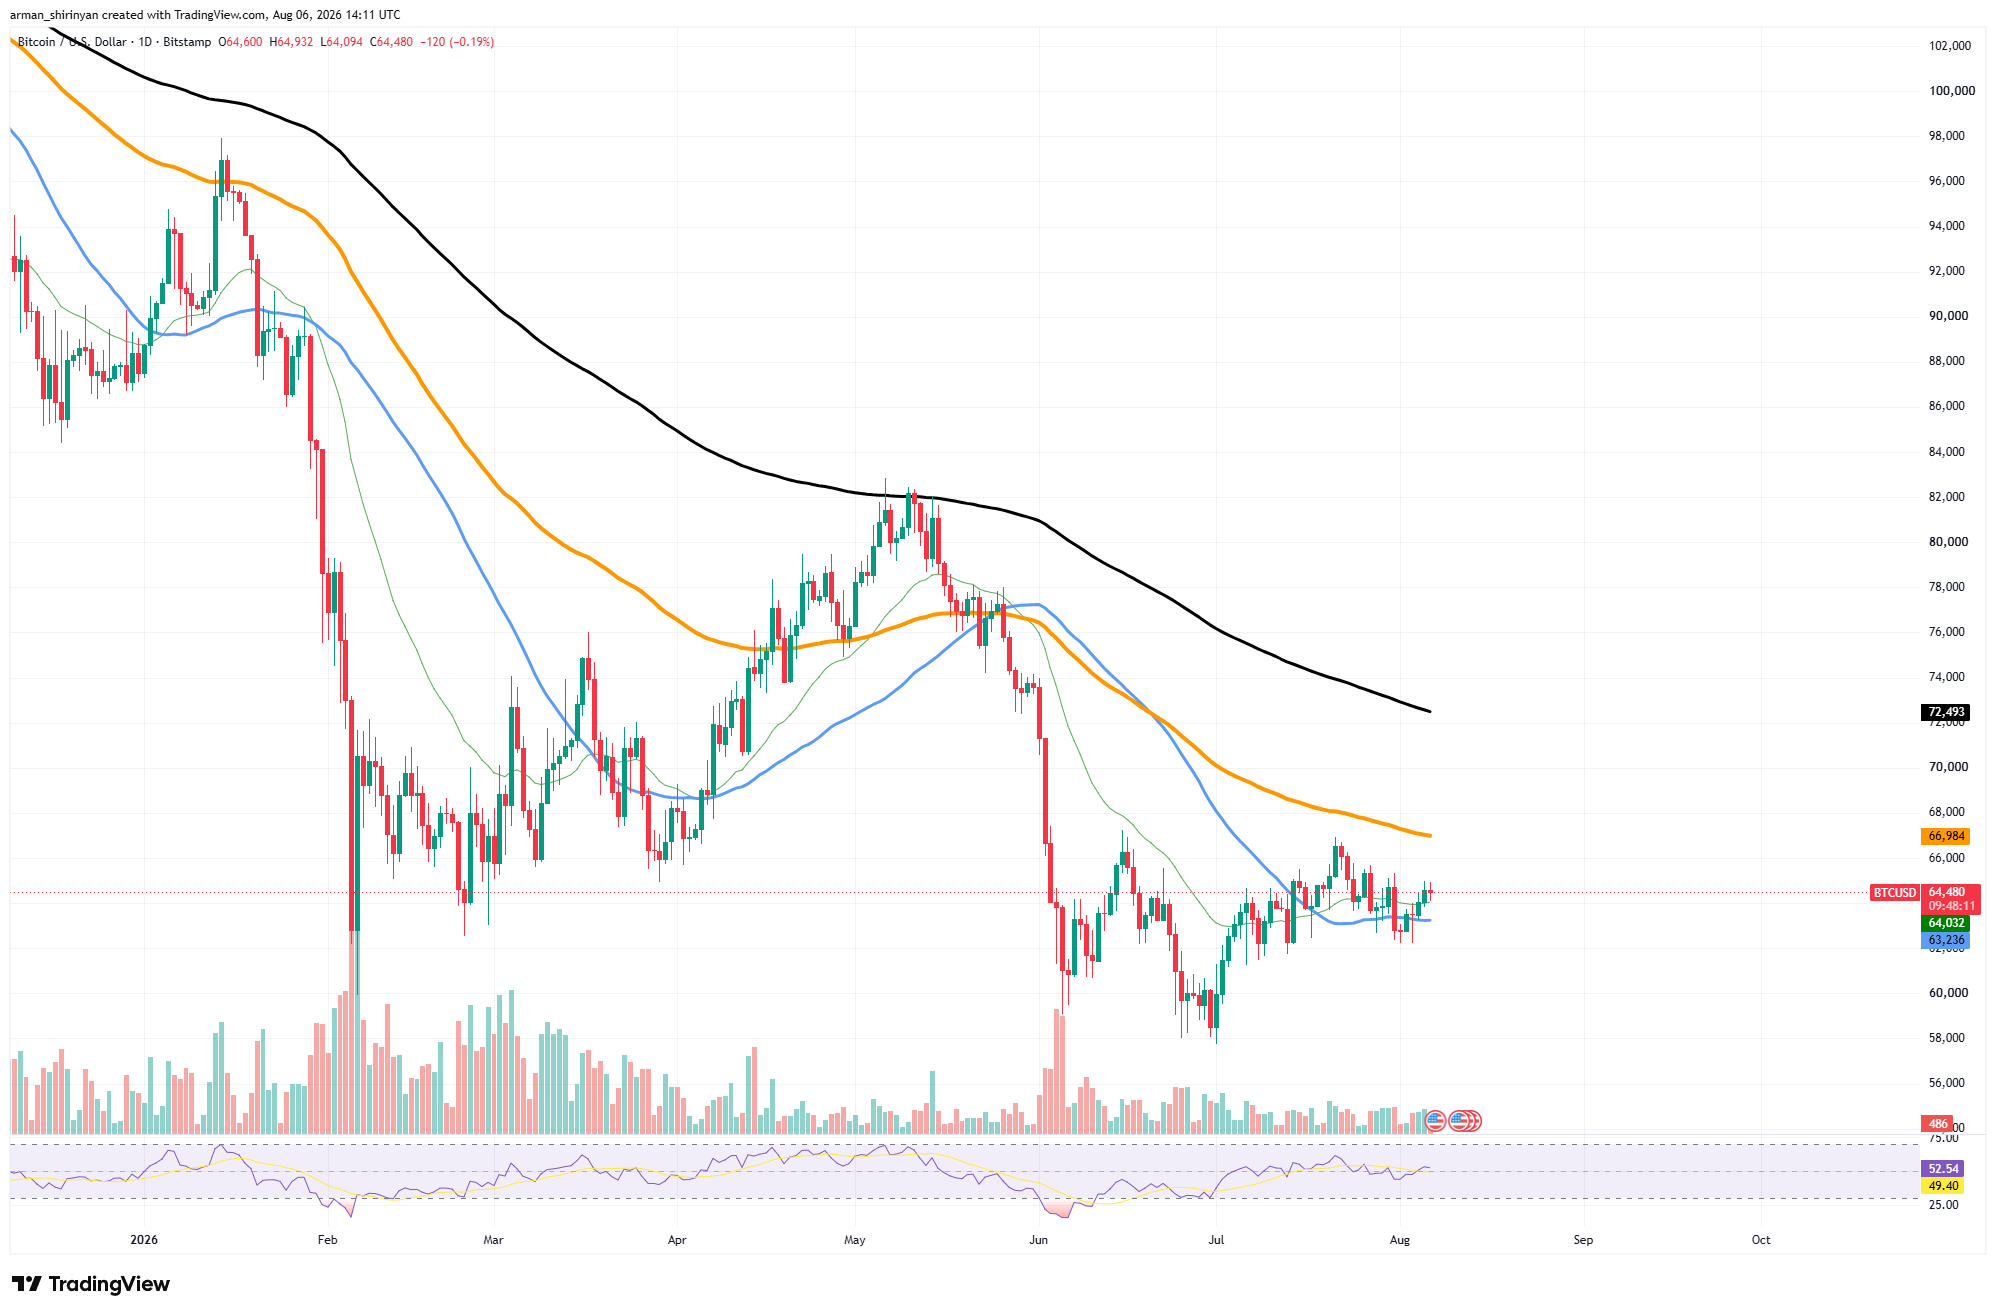
The asset has been able to stay above the 20-day and 50-day moving averages thanks to this consistent accumulation phase — a technical improvement that was not present during the previous downtrend.
While the 50-day moving average has leveled off following months of decline, the 20-day moving average has begun to rise. Although Bitcoin still needs to reclaim higher resistance levels in order to confirm a broader trend reversal, those developments typically indicate that bearish momentum is waning.
The bullish case would be significantly strengthened by a clear breakout above that level, which might pave the way for the declining 200-day moving average close to $72,500. The primary barrier separating Bitcoin from a confirmed trend reversal is still that longer-term indicator.
Without going into overbought territory, buying pressure appears to have surpassed selling pressure as the RSI has risen back above the neutral 50 level to roughly 53. This allows for more upside in the event that volume starts to rise. Institutional conviction has not yet fully returned, as volume has remained comparatively moderate during the recent recovery.
However, Bitcoin has been able to maintain its gains and keep constructing a stable consolidation range above support, in contrast to earlier rallies that were swiftly rejected. For bulls, the $64,000 area remains crucial. Holding above that support maintains the current pattern of higher lows and the recovery structure.
A break below it would probably send Bitcoin back into a more extended phase of consolidation. Bitcoin seems to be returning to a positive technical configuration for the time being.
