
TLDR
- Bitcoin hit $76,120 on Tuesday before pulling back to around $74,400
- Funding rates have been negative for 46 straight days, a pattern last seen after the FTX collapse
- US spot Bitcoin ETFs saw $411.41 million in inflows on Tuesday
- On-chain transaction count rose 62% in 2026, hitting 17-month highs
- Analyst CW8900 says the network is showing “bull market behavior”
Bitcoin (BTC) rallied to an intraday high of $76,120 on Tuesday, its highest level in 70 days, before pulling back to trade around $74,400. The move was driven by a mix of improving on-chain data, ETF inflows, and easing geopolitical tensions.
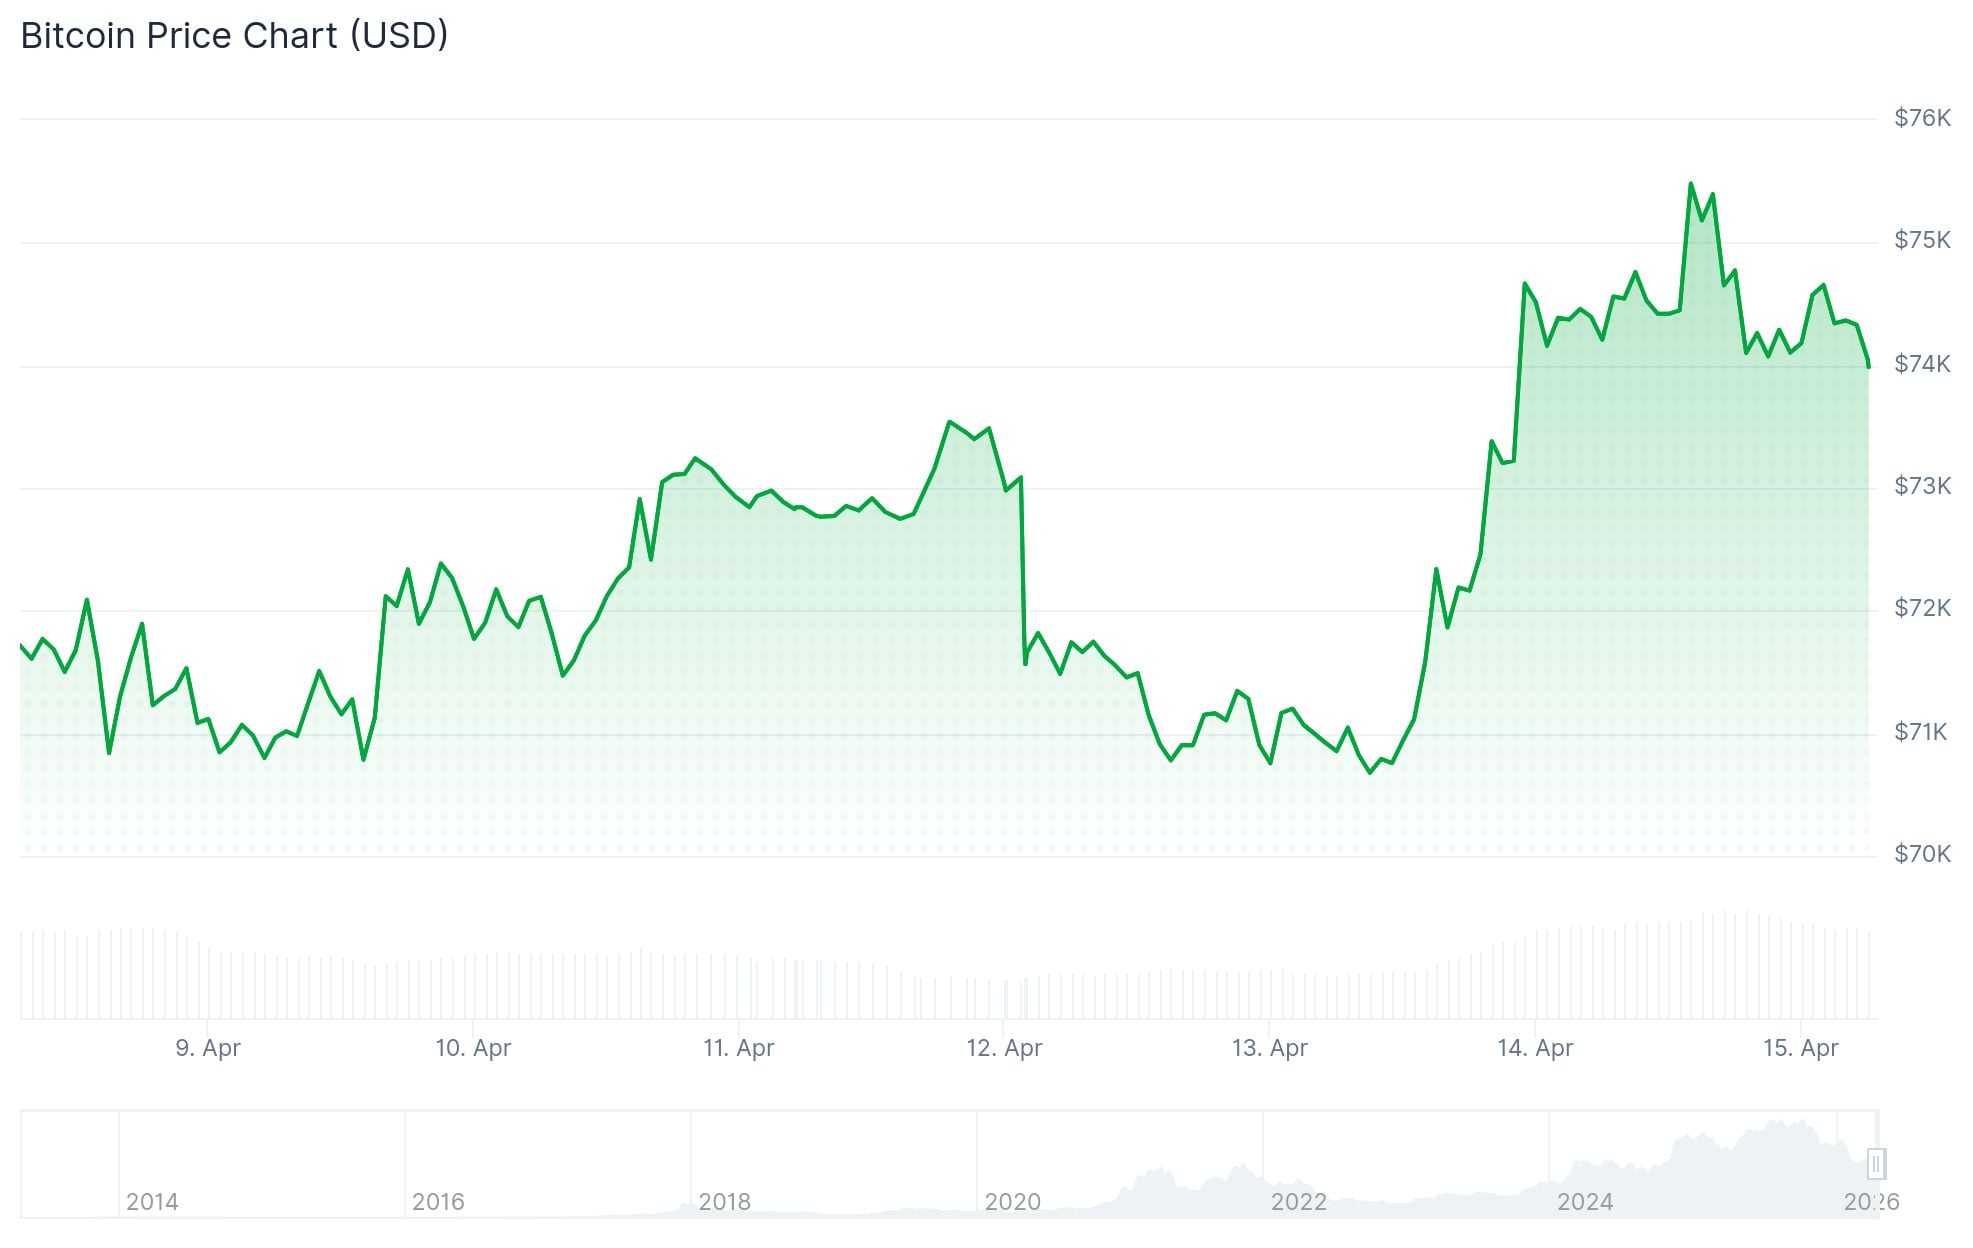
The $76,000 level has acted as a key resistance point for over two months. Bitcoin briefly cleared it before reversing course, leaving traders watching to see if bulls can reclaim it.
From a chart standpoint, Bitcoin broke above the upper trend line of an ascending triangle pattern at $73,000 on Monday. A confirmed daily close above $75,000 would validate the breakout. After that, the next resistance levels sit at $80,000 and then the triangle’s measured target near $89,050.
The daily RSI has climbed to 63, up from oversold levels of 15 back in early February. The MACD histogram is also expanding, pointing to continued upside momentum in the short term.
Analyst CryptoBlockto noted on X that Bitcoin “surged above the $76,000 level, breaking above its March highs and signaling renewed bullish momentum.” The analyst said clearing $76,000 would confirm a trend reversal.
JUST IN📈: $BTC – #Bitcoin surged above the $76,000 level during the New York trading session, breaking above its March highs and signaling renewed bullish momentum.
The move marks a key technical breakout, as the $72,000 – $76,000 zone had acted as a strong resistance area for… pic.twitter.com/KfelXdPfZ2
— Blockto (@CryptoBlockto) April 14, 2026
On-Chain Activity Hits 17-Month Highs
Bitcoin’s daily transaction count rose 62% so far in 2026, reaching 765,130 on April 5. That matches levels last seen in November 2024, when Bitcoin first crossed $100,000.

Analyst CW8900 posted on X: “$BTC daily transaction count is higher than when $BTC was $120K. The network is showing bull market behavior.”
Total fee volume also climbed 4% over the past week to $153,700. Glassnode described this as “heightened on-chain demand,” saying it points to users willing to pay more for transaction priority.
Related articles


ETF Inflows and Funding Rate Signal
US spot Bitcoin ETFs pulled in $411.41 million on Tuesday after a $291.11 million outflow on Monday. Total net assets across Bitcoin ETFs now stand at $94.09 billion, with cumulative net inflows at $57.28 billion.
ETF FLOWS: US SPOT CRYPTO ETFs FLOWS DATA UPDATE (14-04-2026):
🟩 Bitcoin ETFs: +5,538 $BTC (+$411.50M)
🟩 Ethereum ETFs: +22,904 $ETH (+$53.03M)
🟩 XRP ETFs: +8.25M $XRP (+$11.20M)
🟩 SOLANA ETFs: +15.14K $SOL (+$1.27M)
🟩 ChainLink ETFs: +142.43K $LINK (+$1.28M)
🟩 DOGECOIN… https://t.co/tLzHzoxqPb pic.twitter.com/Mv3mu5OeVf— Crypto Patel (@CryptoPatel) April 15, 2026
Vetle Lunde, head of research at K33 Research, pointed out that funding rates on Binance’s Bitcoin perpetuals have stayed negative for 46 straight days, even as open interest rises. This means new short positions are being added rather than closed.
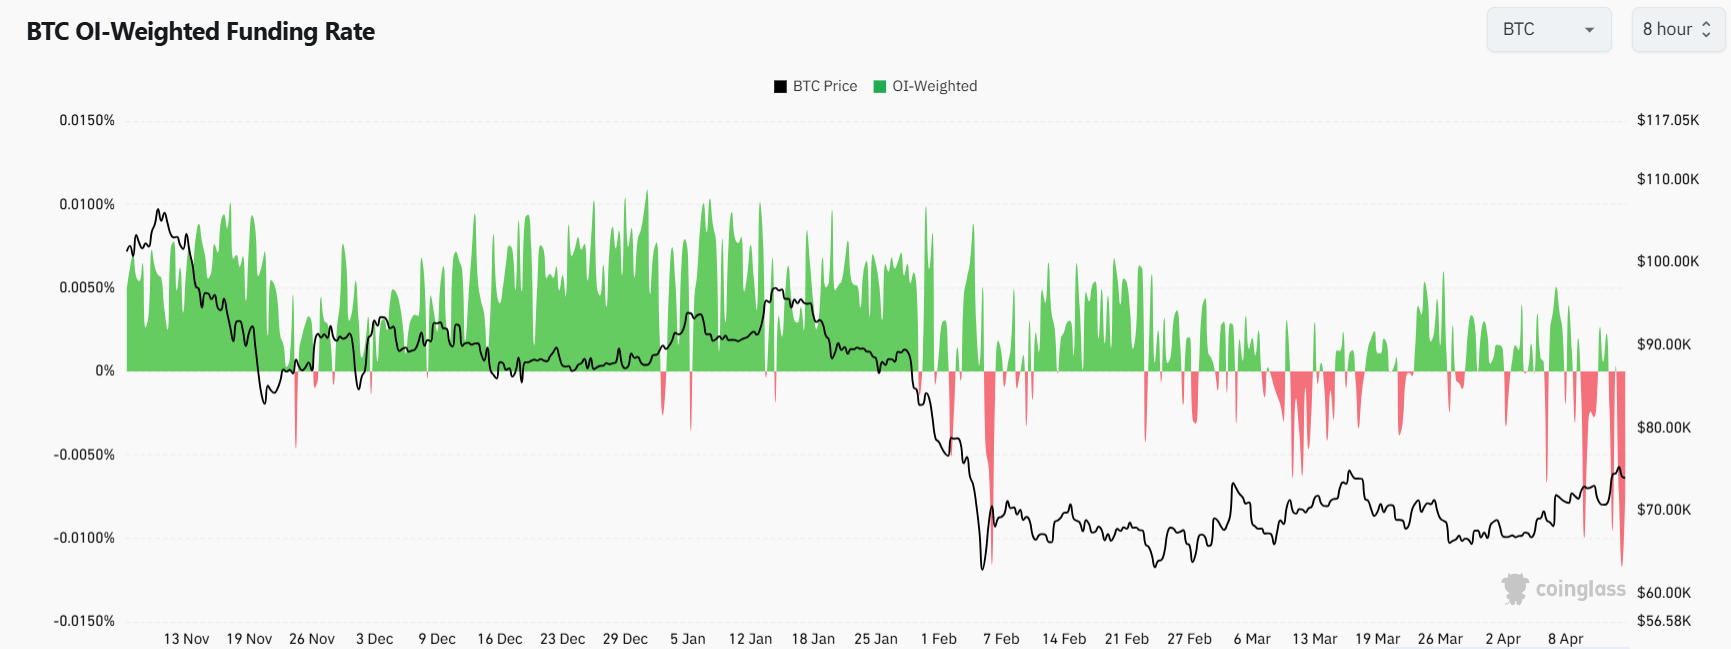
“Comparable risk-off regimes have historically been attractive entry points for BTC,” Lunde said. The last time funding rates stayed negative this long was following the FTX crash in late 2022, which marked the bottom of that bear market.
If sellers push back, support sits at the 50-day EMA around $71,021, with further downside targets at $68,950 and $67,412.