Welcome to this week’s publication of the Market’s Compass Weekly Crypto Sweet Sixteen Study. The Study tracks the technical condition of sixteen of the larger market cap cryptocurrencies. Although I did not publish a Study last week as I enjoyed a well deserved summer vacation, I calculated and “filled in” the historic quantitative objective technical ranking data and secondary technical indicators including the Sweet Sixteen Total Technical Rankings and Weekly Average Technical Ranking for the week ending June 21st. Every week the Studies will highlight the technical changes of the 16 cryptocurrencies that I track as well as individual highlights on noteworthy moves in certain cryptocurrencies and Indexes.
The Excel spreadsheet below indicates the weekly change in the objective Technical Ranking (“TR”) of each individual Cryptocurrency. The technical ranking or scoring system is an entirely quantitative approach that utilizes multiple technical considerations that include but are not limited to trend, momentum, measurements of accumulation/distribution and relative strength. If an individual Cryptocurrency’s technical condition improves the Technical Ranking (“TR”) rises, and conversely, if the technical condition continues to deteriorate, the TR falls. The TR of each individual Cryptocurrency can range from 0 to 50. The spreadsheet below also acts as a “heat map” in that, cryptocurrencies with a TR in the range of 1 to 15 are highlighted in red, 15.5 to 34.5 are noted in blue and TRs in the range of 35 to 50 are in green. The primary take-away from this spread sheet should be the trend of the individual TRs, either the continued improvement or deterioration, as well as a change in direction. A sustained trend change needs to unfold in the individual TRs for it to be actionable. Secondarily a very low ranking can signal an oversold condition and conversely a continued very high number can be viewed as an overbought condition but, as we know, over sold conditions can continue at apace and overbought securities that have exhibited extraordinary momentum can easily become more overbought. Thirdly, the weekly TRs are a valuable relative strength/weakness indicator vs. each other, in addition when the Sweet Sixteen Total Technical Ranking (“SSTTR”), that has a range of 0 to 800, is near the bottom of its range and an individual cryptocurrency has a TR that remains elevated it speaks to relative strength. Conversely if the SSTTR is near the top of its recent range and an individual cryptocurrency has a TR that remains mired at low levels it speaks to relative weakness. Lastly I view the objective Technical Rankings as a starting point in my analysis and it is not the entire “end game”.
This Week’s and 10 Week Trailing Technical Rankings of the 16 Individual Cryptocurrencies*
*Rankings are calculated up to the week ending Friday July 28th
Three weeks ago the SSTTR rose to 492 from 365 the week before. That reading marked the highest level since the week ending April 14th. Since then the SSTTR has fallen -14.13% to 422.5 over the past two weeks.
On a Wow basis, only two Cryptocurrencies registered improvements in their objective TRs, two were unchanged and twelve fell. The average TR loss was -2.56. Five of Sweet Sixteen ended the week in the “green zone” (TR of between 35 and 50), seven were in the “blue zone” (TRs between 15.5 and 34.5) and four ended the week in the “red zone” (TRs between 1 and 15). The previous week there were five in the “green zone”, ten were in the “blue zone” and only one in the “red zone” that fell even farther in the “red zone” last week. That one is Cosmos, which dropped to 8.5 from 14 and it also sported the lowest objective technical ranking (8.5) of the Sweet Sixteen we track in these pages. Also, note the relative weakness vs. the CCi30 Index in the lower panel of the chart below (blue line).

Relative Strength and Weakness in the Sweet Sixteen vs. The CCi30 Index*.
*The CCi30 Index is a registered trademark and was created and is maintained by an independent team of mathematicians, quants and fund managers lead by Igor Rivin. It is is a rules-based index designed to objectively measure the overall growth, daily and long-term movement of the blockchain sector. It does so by indexing the 30 largest cryptocurrencies by market capitalization, excluding stable coins (more details can be found at CCi30.com).
Relative Strength and Weakness utilizing a Relative Rotation Graph of the Sweet Sixteen
The Relative Rotation Graph, commonly referred to as RRGs were developed in 2004-2005 by Julius de Kempenaer. These charts are a unique visualization tool for relative strength analysis. Chartists can use RRGs to analyze the relative strength trends of several securities against a common benchmark, (in this case the CCi30 Index) and against each other over any given time period. I have changed this weeks RRG chart to cover the 14 days since I last published the Crypto Sweet Sixteen Blog. The power of RRG is its ability to plot relative performance on one graph and show true rotation. All RRGs charts use four quadrants to define the four phases of a relative trend. The Optuma RRG charts uses, From Leading (in green) to Weakening (in yellow) to Lagging (in pink) to Improving (in blue) and back to Leading (in green). True rotations can be seen as securities move from one quadrant to the other over time. This is only a brief explanation of how to interpret RRG charts. To learn more, see the post scripts and links at the end of this Blog.

As I said previously, this week’s RRG chart covers 14 days. Other than the fact I did not publish last week I want to highlight the rotation into and out of a few of the cryptocurrencies of interest. The first visual takeaway from the 14 Day Relative Rotation Graph of the Sweet Sixteen is the change in trajectory of Ripple (XRP). When I last published XRP had just entered the Leading Quadrant. It continued climbing in the Leading Quadrant exhibiting exceptional relative strength and relative momentum until it began to slow and turn lower into the end of last week when it dropped into the Weaking Quadrant. It is not my bailiwick to discuss fundamentals, rumors or speculation so I will not do so but what I can say is that in non-technical terms is that the bloom, at least partially, has fallen off of that rose. That said, XRP still remains a good deal away from the center of the grid which marks the comparison Index (CCi300 Index). Both Matic Network (MATIC) and Solana (SOL) have also fallen into the Weakening Quadrant as well. At the risk of boring readers with another idiom, every dog has his day, Dogecoin (DOGE) has slowly risen into the Leading Quadrant. ChainLink (LINK) has moved into the Leading Quadrant from the Weakening Quadrant as well.
Seven Day Absolute % Price Change*

*Friday June 21st to Friday June 28th
The Technical Condition Factor changes for the week ending June 28th and trailing ten weeks.
There are eight Technical Condition Factors (“TCFs”) that determine individual TR scores (0-50). Each of these 8, ask objective technical questions (see the spreadsheet posted above). If a technical question is positive an additional point is added to the individual TR. Conversely if the technical question is negative, it receives a “0”. A few TCFs carry more weight than the others such as the Weekly Trend Factor and the Weekly Momentum Factor in compiling each individual TR of each of the 16 Cryptocurrencies. Because of that, the excel sheet above calculates each factor’s weekly reading as a percent of the possible total. For example, there are 7 considerations (or questions) in the Daily Momentum Technical Condition Factor (“DMTCF”) of the 16 Cryptocurrencies ETFs (or 7 X 16) for a possible range of 0-112 if all 16 had fulfilled the DMTCF criteria the reading would be 112 or 100%.

After reaching a nearly overbought level of 83.04% three weeks ago the DMTCF has fallen back to 40.18% to just below neutral.
As a confirmation tool, if all eight TCFs improve on a week over week basis, more of the 16 Cryptocurrencies are improving internally on a technical basis, confirming a broader market move higher (think of an advance/decline calculation). Conversely, if more of the TCFs fall on a week over week basis, more of the “Cryptos” are deteriorating on a technical basis confirming the broader market move lower. Last week three TCFs rose and five fell confirming the slight weakness at the index level.
The CCi30 Index with This Week’s Sweet Sixteen Total Technical Ranking “SSTTR” Overlaid
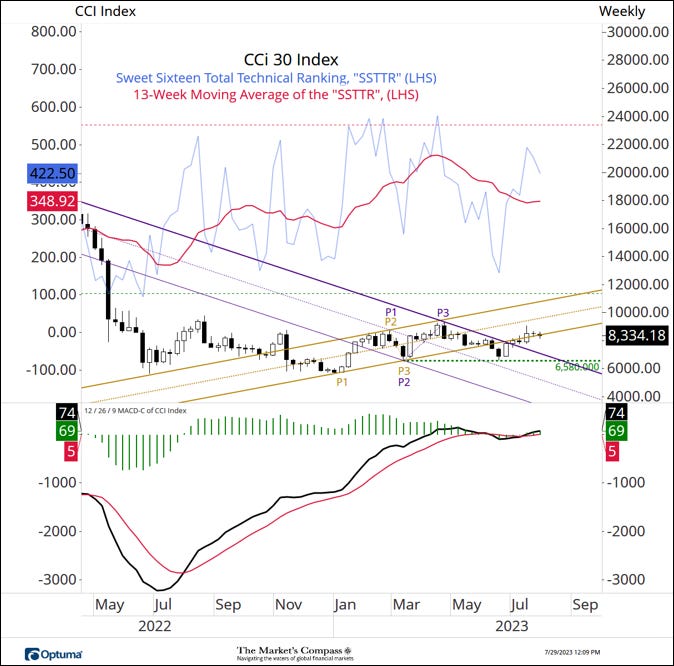
MACD of the the CCi30 Index reflects the lack of either measurable upside or downside price momentum since the index moved away from key support at the the 6,580 level despite the nearly 21% rally after it came close to tagging support a month and a half ago. This is what I like to refer to as a grind higher and not an impulsive rally that suggests the base building price action is complete. Despite a pullback in in the SSTTR over past couple of weeks and a flattening of the 13-week moving average (red line) there is very little to become technically excited about (well, until there is) in the above chart.
The CCi30 Index Weekly Cloud Model with the Average Sweet Sixteen Technical Ranking (ASSTR)*

There is a touch more to be technically positive about in the above Candlestick Cloud Chart. Prices have held above the Kijun Plot (green solid line) since moving back into the Cloud in late-June. The ASSTR held support at the long term moving average (blue line) and the shorter term moving average (red line) of the Average Technical Ranking is tracking higher. We continue to mark key resistance at 9,320 and only a breakout with follow through would suggest the base building process has run its course.
Charts are courtesy of Optuma whose charting software enables anyone to visualize any data including RRG Charts and our Objective Technical Rankings. Cryptocurrency price data is courtesy of Cryptowatch.
The following links are an introduction and an in depth tutorial on RRG Charts…
https://www.optuma.com/videos/introduction-to-rrg/
https://www.optuma.com/videos/optuma-webinar-2-rrgs/
To receive a 30-day trial of Optuma charting software go to…
A three part tutorial series on Andrews Pitchfork may be read at my web site…. www.themarketscompass.com