




Following a violent selloff that drove the price of the cryptocurrency from the $82,000 range to $59,000, it is now trying to stabilize. Although Bitcoin has recently risen above $64,000, the larger technical structure is still negative. The recovery from the local bottom established in early July is the most noteworthy development. In the vicinity of the $58,000-$60,000 support area, buyers intervened forcefully, averting a further decline and creating a string of higher lows.
After weeks of weakness, the RSI has recovered above 50, indicating that momentum is progressively improving. But there is still a lot of overhead resistance for Bitcoin. The current price action is directly below the 50-day EMA at $64,800, which has already begun to function as a ceiling.
Beyond that, bulls must overcome a stacked resistance structure created by the 100-day EMA at $68,700 and the 200-day EMA at $74,800 before any significant trend reversal can be confirmed. Additionally, during the recovery, volume has remained comparatively muted, indicating that institutional conviction is still incomplete.
For the time being, the move is more akin to a relief rally than the start of a new bullish cycle. A move toward $68,000-$70,000 is more likely if Bitcoin can secure a breakout above the 50-day EMA. If this is not achieved, the $60,000 support area may be tested once more.
Dogecoin’s active battle
With the asset trading close to $0.073 and displaying few indications of a long-term recovery, Dogecoin is still struggling under intense bearish pressure. The chart clearly shows a months-long downward trend. With the 50-day EMA at roughly $0.084, the 100-day EMA near $0.091, and the 200-day EMA above $0.106, DOGE is still below all major moving averages.
You Might Also Like

This alignment demonstrates that the market is still dominated by sellers. Following the recent decline toward $0.071, there was a brief attempt at a rebound, but buyers were unable to muster enough momentum to overcome the surrounding resistance. Earlier this month, the rejection close to the 50-day EMA confirmed the current trend’s weakness. The fact that the RSI is still close to 35, which puts DOGE near oversold territory, is one positive sign.
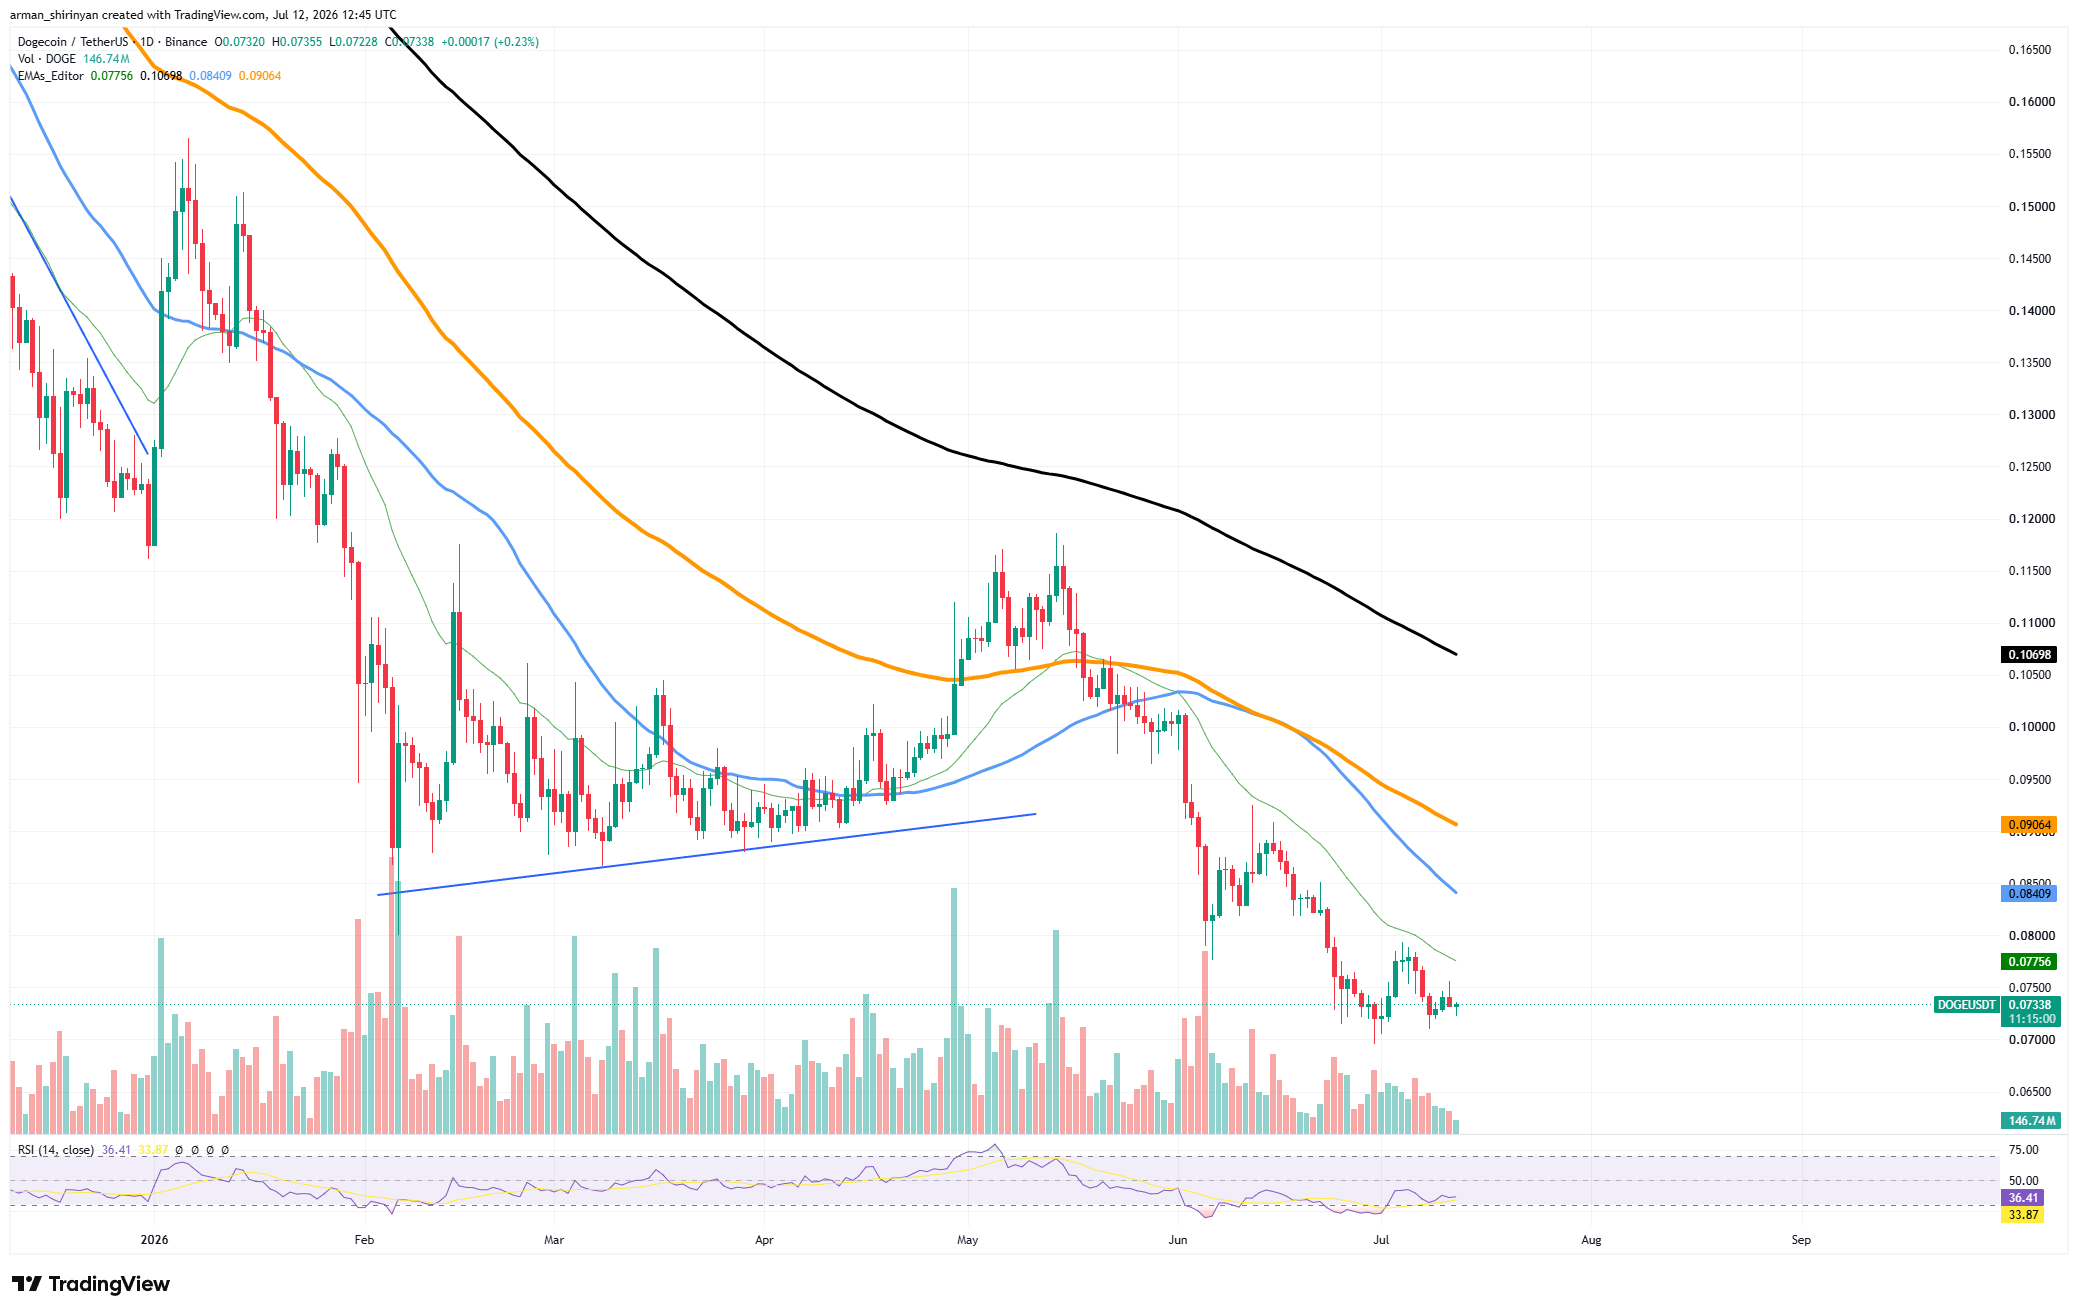
These readings have historically frequently preceded brief relief rallies. However, oversold conditions alone do not guarantee a reversal, particularly when overall market sentiment is still unstable. At $0.070, the crucial support is still present. If that level is lost, DOGE may be subject to additional selling pressure. Bulls must first recover $0.080 on the upside before a more significant recovery can be discussed.
While Dogecoin is still one of the weaker large-cap assets in the market and is still looking for a solid bottom, Bitcoin is currently exhibiting early indications of stabilization.
Shiba Inu bulls aren’t in control
Shiba Inu is still stuck in a long-term downtrend, and there is little indication from recent price movement that bulls are prepared to take back control. SHIB is currently trading at $0.0000043 after breaking down from a rising wedge formation that formed between March and May, and then entered another leg lower.
The technical picture is still weak. With the 50-day EMA serving as immediate resistance around $0.0000045 and the 100-day and 200-day averages significantly higher, SHIB trades below all major moving averages. Sellers continue to benefit from this stacked bearish structure. The apparent stabilization close to the $0.0000040 support area is one noteworthy development.
You Might Also Like

Throughout the past few weeks, buyers have repeatedly defended this level, averting a total collapse. Nevertheless, every attempt at a recovery has resulted in lower highs, indicating a lack of confidence among market participants. During rebounds, volume has also not increased significantly.
This implies that the recent increase is mostly technical rather than the result of new money entering the asset. Despite the slight recovery from local lows, the RSI is still below 40, indicating weak momentum. Bulls must recover the 50-day EMA and establish support above $0.0000045 in order for SHIB to improve its outlook.
The next significant resistance zone, the $0.0000050 region, could be reached with such a move. SHIB continues to be on the defensive until that time. The trend still favors caution over aggressive accumulation, even though the market appears to be looking for a bottom.
Zcash’s best performance
After its remarkable surge earlier this year, Zcash is still among the best-performing larger-cap altcoins. ZEC has maintained an exceptionally robust technical structure in spite of the considerable volatility brought on by the inflation bug incident and the ensuing market reaction.
With the 50-day EMA close to $464, the 100-day EMA close to $475, and the 200-day EMA close to $392, the asset currently trades above all major moving averages. This alignment shows that long-term buyers are still active and is typically associated with robust uptrends. ZEC spent several weeks consolidating between $380 and $500 after correcting from highs close to $700.
You Might Also Like

The consolidation phase may be coming to an end, according to the recent breakout above the 50-day and 100-day moving averages. The crucial $540 resistance level, which has repeatedly rejected advances since June, is now being approached by the price. Moreover, momentum is increasing. With the RSI rising above 60 without entering overbought territory, there is potential for further gains if buying pressure persists. Relative strength is the primary distinction between ZEC and many other altcoins.
Zcash has successfully recovered the major moving averages and is creating a string of higher lows, even though a large portion of the market is still below them. A move toward $600 becomes more likely if buyers are able to surpass $540. The overall structure remains bullish unless ZEC drops back below the $460-$470 support range. Failure to break resistance could lead to another period of consolidation.
