Relative Strength Index (RSI)
RSI was one of the first indicators that I learnt how to use, and by using it without any other indicator, I was able to generate profit.
RSI indicates if a coin is in overbuy or oversell, allowing you to make better entry decisions.
This is what it looks like:
The chart ranges between 0 and 100, but the values that really interest you are the 70 and the 30.
If the RSI value falls below 30, then this is a buying/longing sign. If it goes above 70, then it is a selling / shorting sign.
Applying this with the price action of BTC, we get the following output:
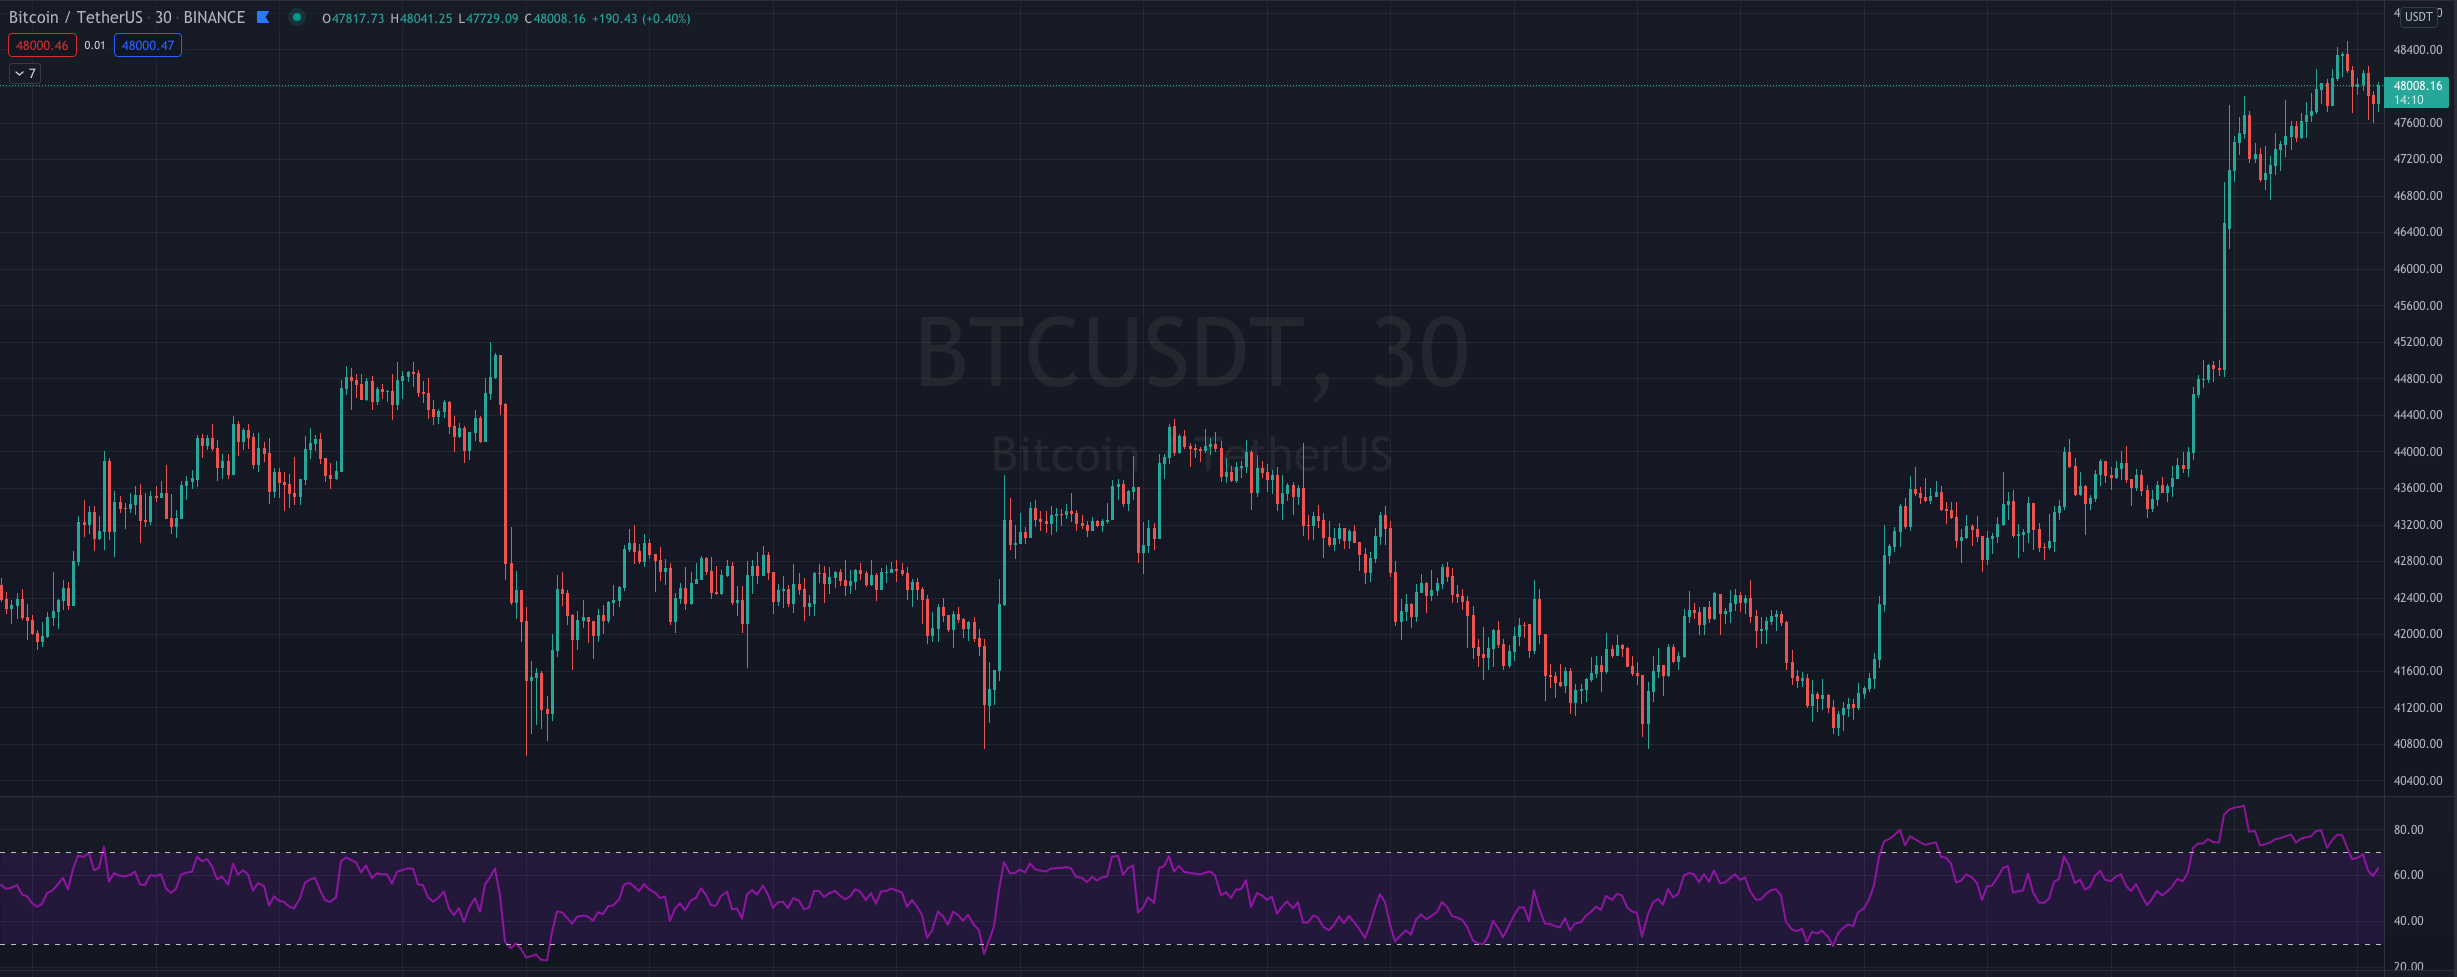
As you can see, RSI is very easy to understand and start using, when you add this indicator, the 70 and 30 lines already come in the chart, so you don’t even have to memorize those numbers.
Moving Averages
Moving Averages (from here on mentioned as “MA”) are what I consider to be an essential indicator. It mainly indicates the presence of a trend, but you can also use it to plan entry and exit points (when more than one MA is used).
There are 2 types of MA’s and below you can see the definition for both of them, according to Investopedia :
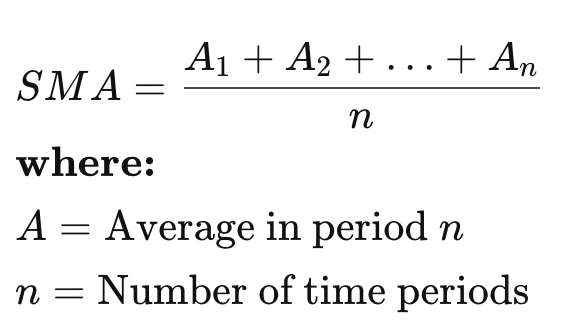
Simple Moving Average (SMA)
The simplest form of a moving average, known as a simple moving average (SMA), is calculated by taking the arithmetic mean of a given set of values over a specified period of time. In other words, a set of numbers–or prices in the case of financial instruments–are added together and then divided by the number of prices in the set. The formula for calculating the simple moving average of a security is as follows
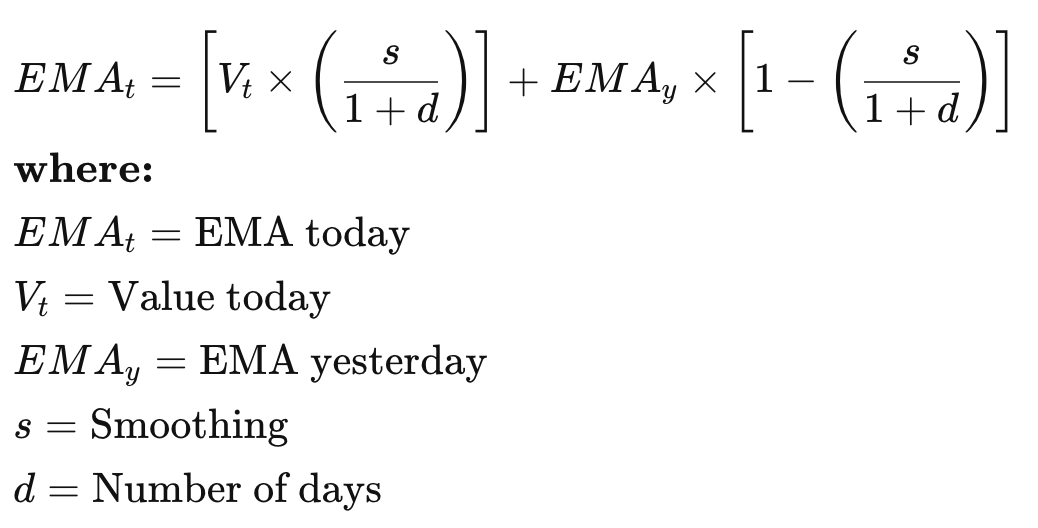
Exponential Moving Average (EMA)
The exponential moving average is a type of moving average that gives more weight to recent prices in an attempt to make it more responsive to new information. To calculate an EMA, you must first compute the simple moving average (SMA) over a particular time period. Next, you must calculate the multiplier for weighting the EMA (referred to as the “smoothing factor”), which typically follows the formula: 2/(selected time period + 1). So, for a 20-day moving average, the multiplier would be 2/(20+1)= 0.0952. Then you use the smoothing factor combined with the previous EMA to arrive at the current value. The EMA thus gives a higher weighting to recent prices, while the SMA assigns an equal weighting to all values.
I personally prefer to use EMA’s as it reacts faster to what is happening right now. Making the present weigh the same as the past is less relevant, in my opinion.
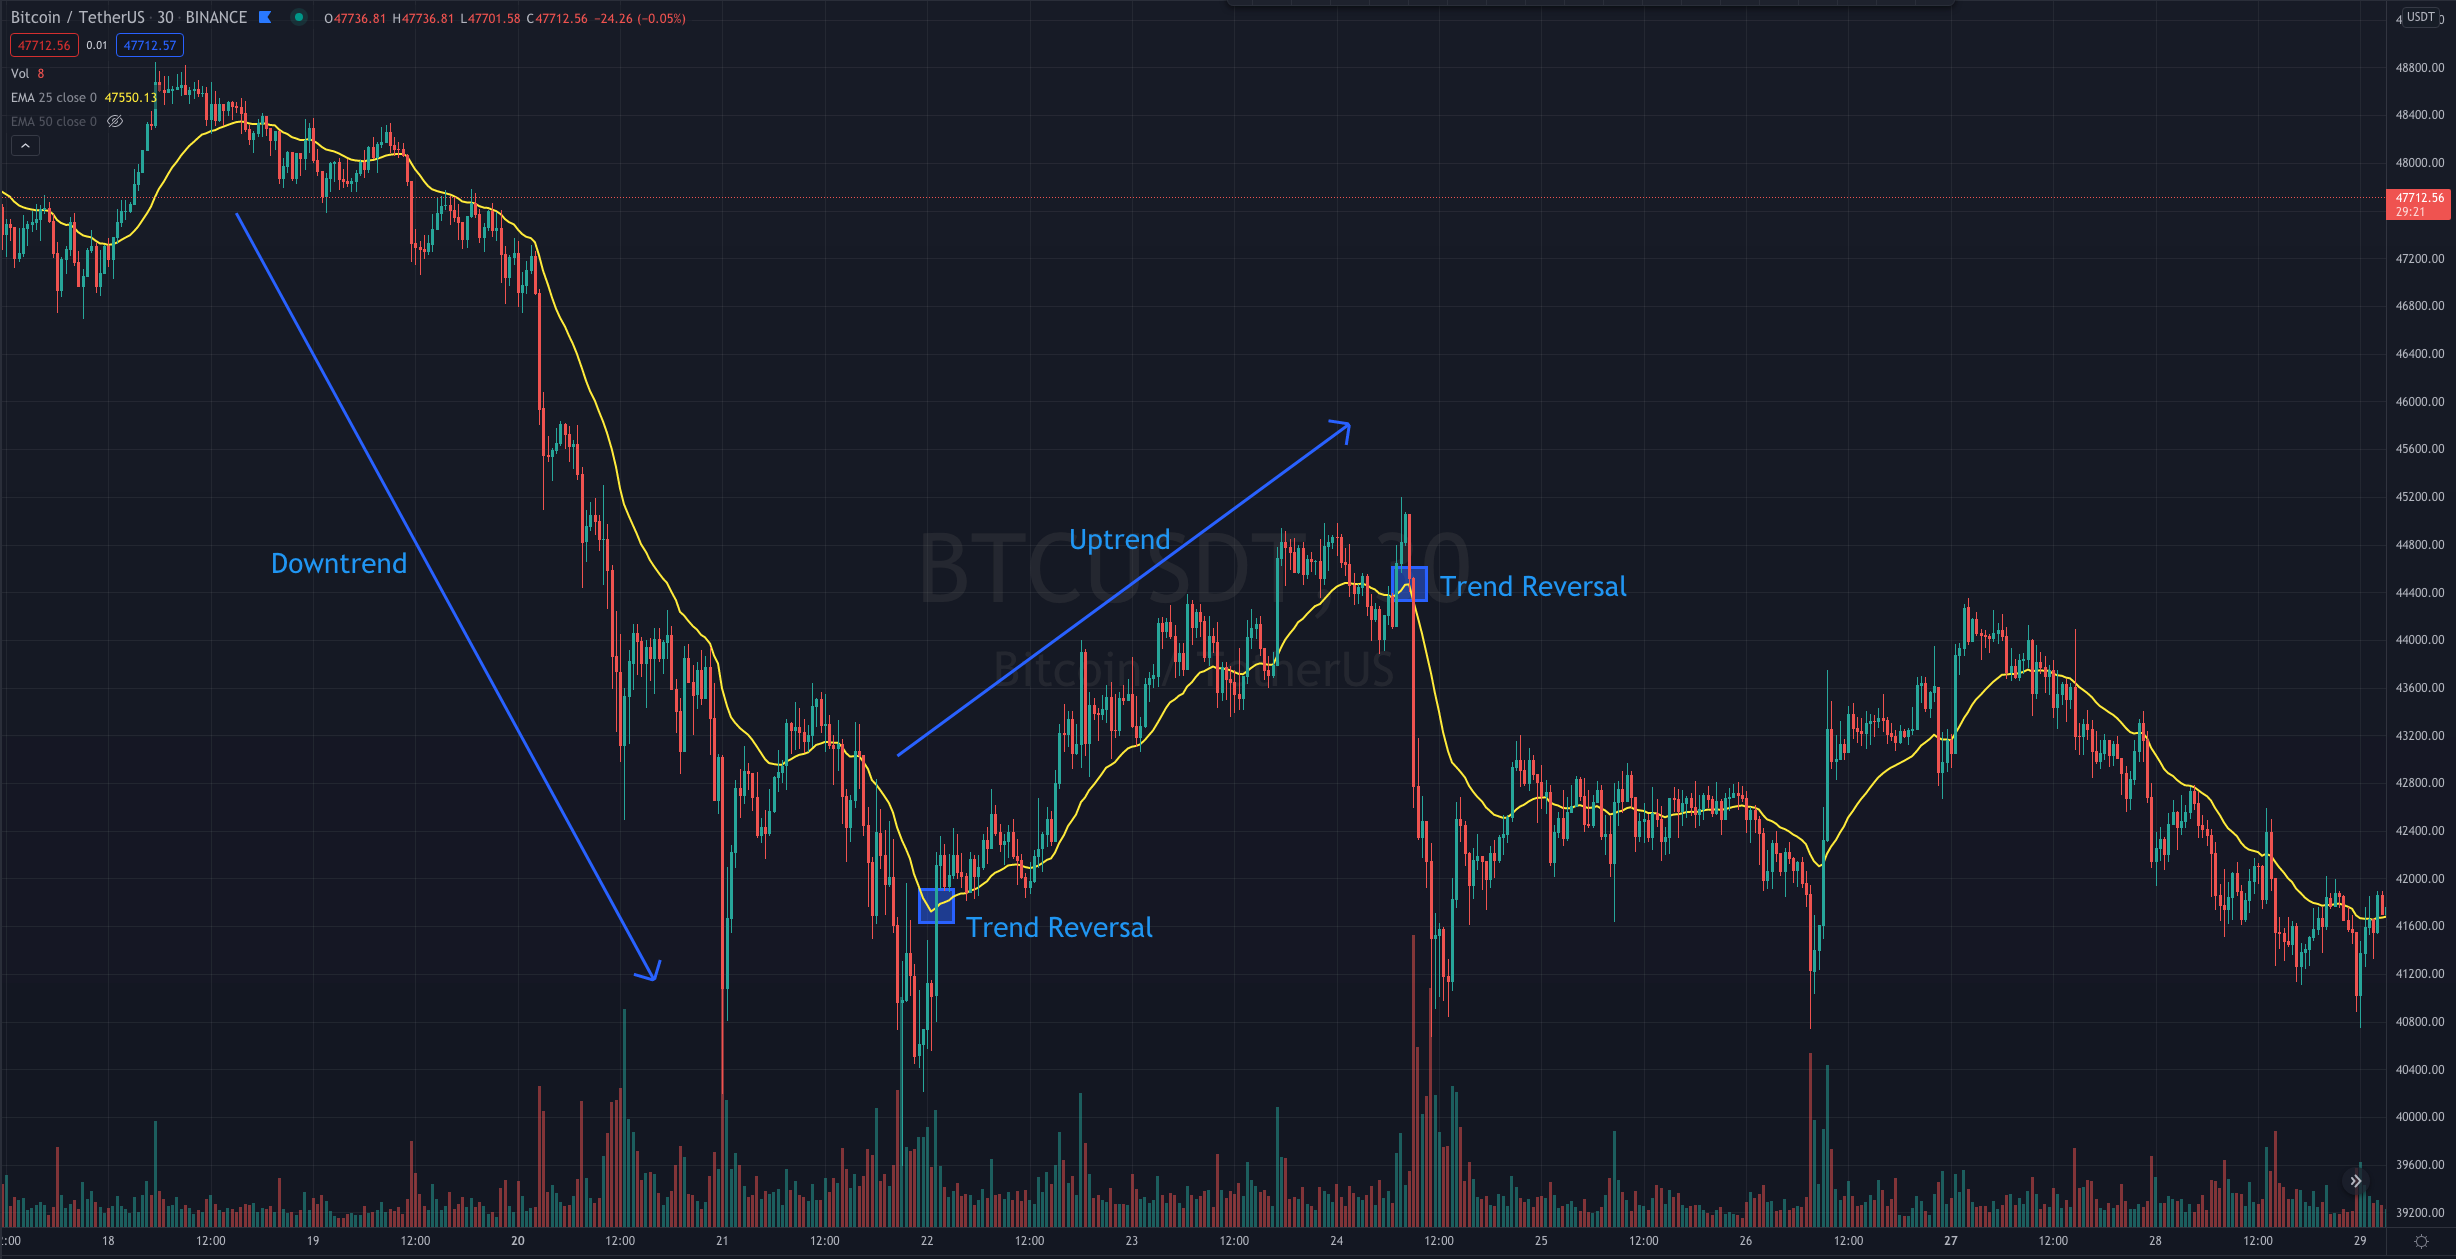
And how can this be used in crypto trading? Well, there is more than one way. The most basic one is: If a coin is trading above the MA line, then there is an uptrend, if a coin is trading below the MA, then there is a downtrend. When the price crosses MA, then you may be looking at a trend reversal.
As you saw in the definitions of MA, the formulas take into account periods which means, how many candles back do you want to include in the calculations. So, if I set a MA for the last 20 periods on BTC hourly chart, I will be adding a MA for the last 20 hours. The periods I use the most are 12, 25, and 50. Keep in mind that the smaller the number of periods, the faster the MA will react to price action.
Check the example below of EMA 25 applied on BTC 30 minutes chart:
Usually, MA’s are used in pairs. I like to always have them on my charts, and the standard is to have one that reacts slower than the other. I like to use 25 and 50 periods.
This gives you better accuracy than using the single MA. Like before, a price above MA means uptrend, and a price below MA means downtrend. But now, we have an additional piece of information which is when the two lines cross.
If we are in a downtrend, the fast MA will be below the slow MA. This happens because it is more heavily affected by the recent low prices.
When the fast MA line crosses the slow MA line, this is an entry / long sign. It means that we may be entering an uptrend.
The same applies to downtrends, but in this case, the slow MA line is above the fast one. When the lines cross, it means we may be entering a downtrend and is therefore a sell / short sign.
Below is an example of this applied on BTC 30 minutes chart, using EMA 25 (yellow line) and EMA 50 (green line):
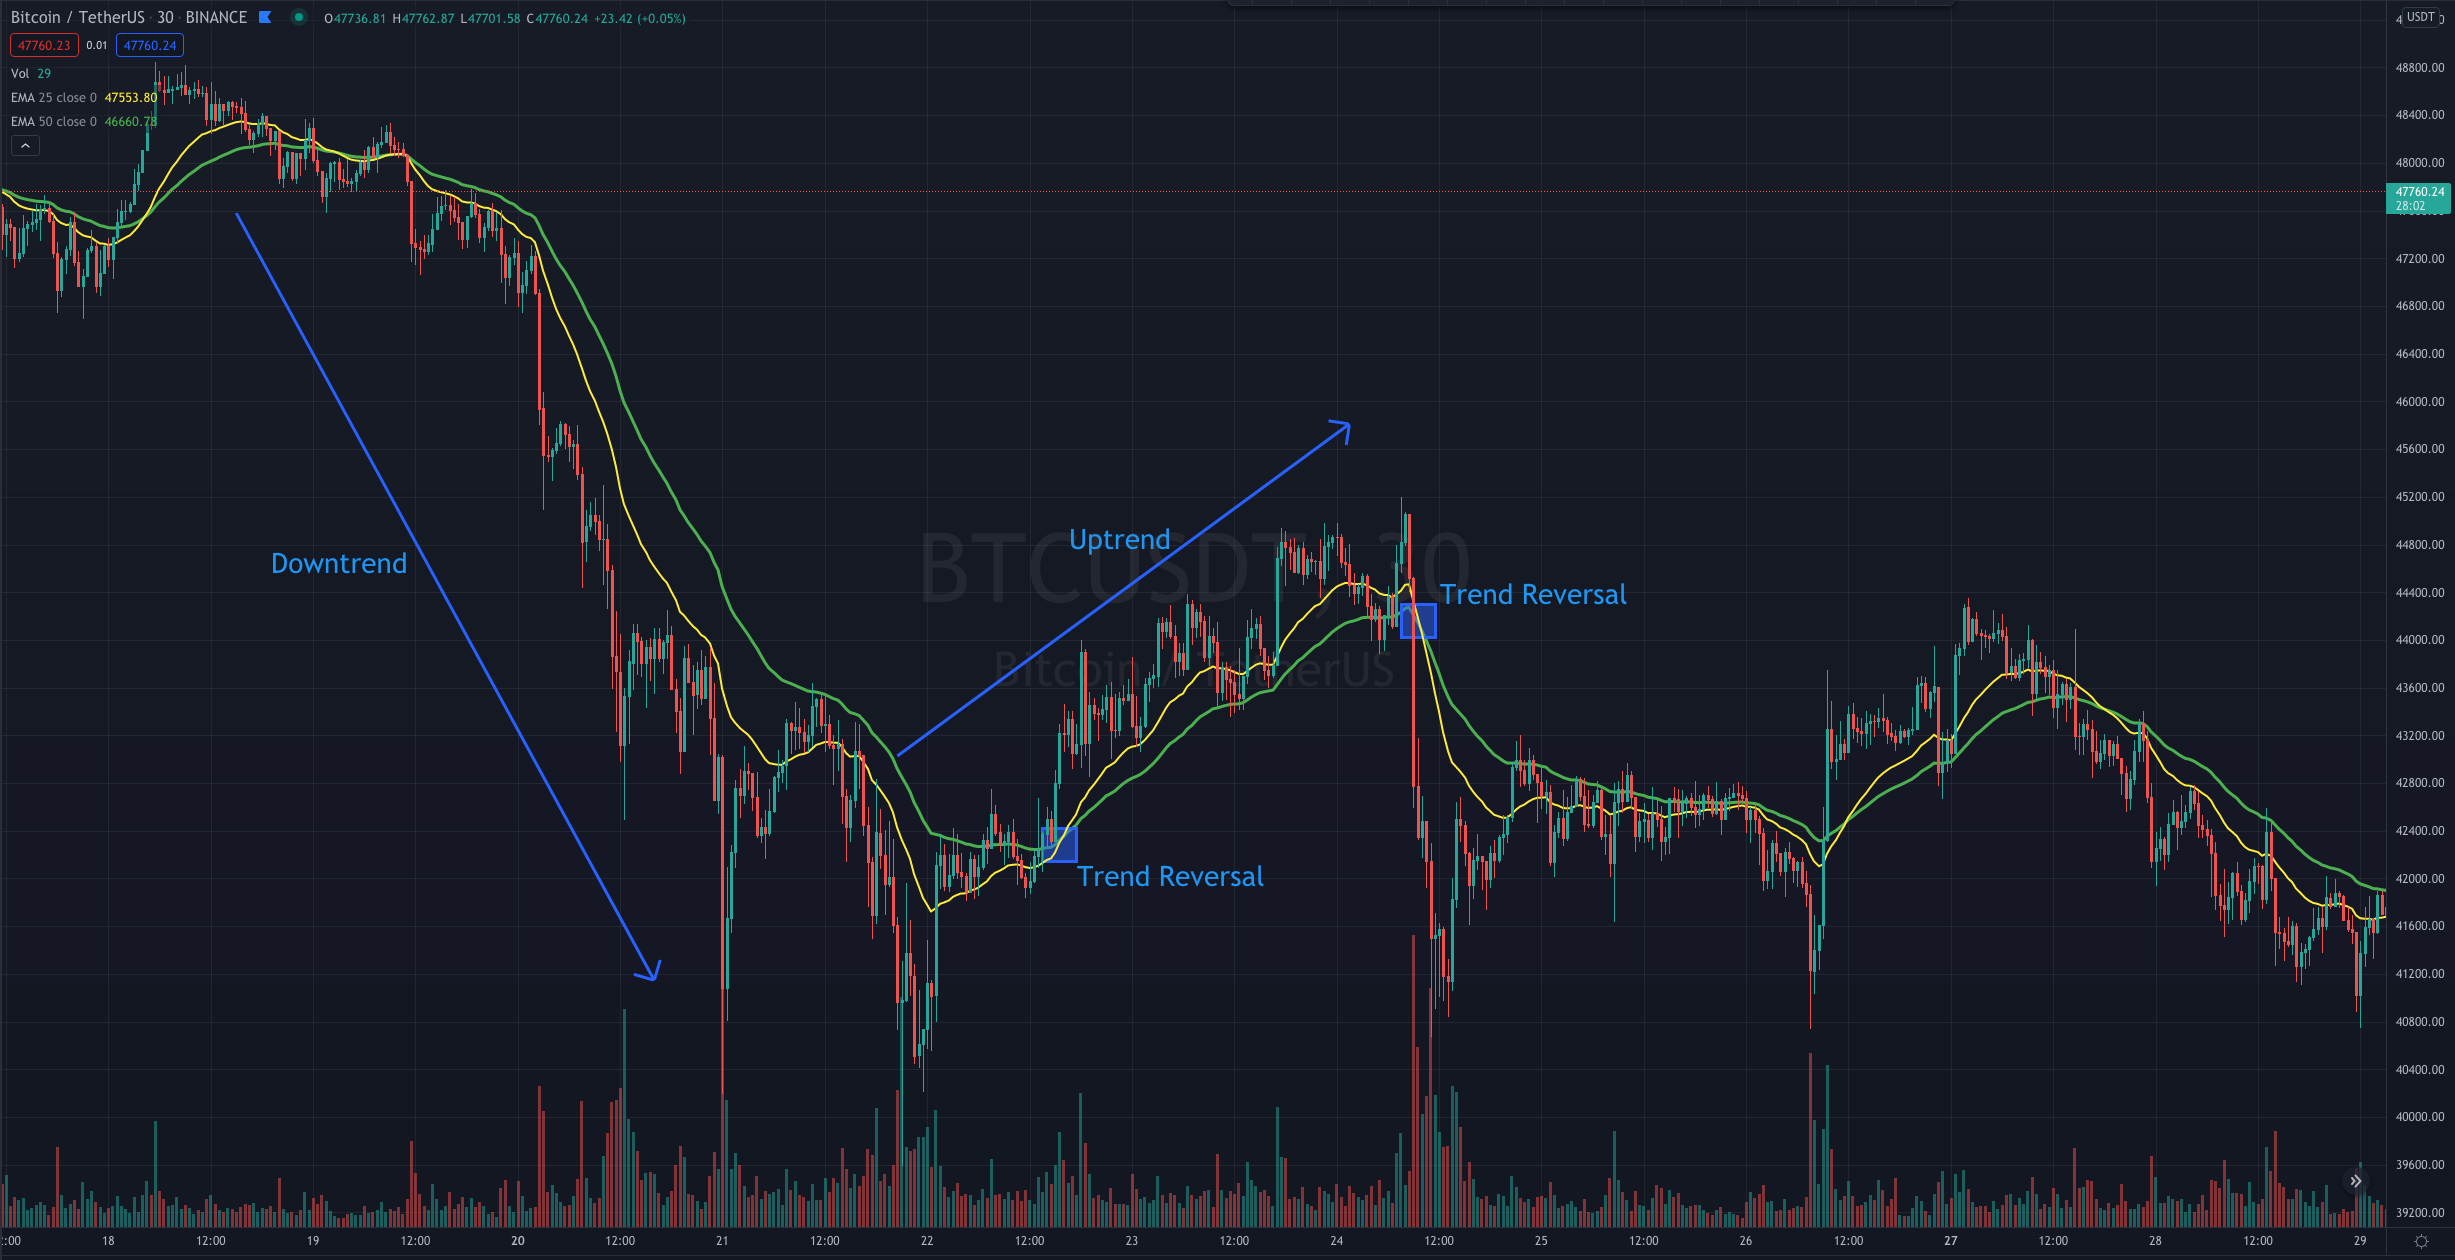
I think it is important to note a big difference between these two methods. If you apply the principle of single MA and check the chart, you will see that you would have occasions where the uptrend wasn’t confirmed. With the two MA’s, these errors wouldn’t have occurred. On one hand, you will get in trades later, but on the other hand, you will prevent many unprofitable trades.
You also need to take into account that this can not be applied based on the current candle. For these rules to work, base yourself on past candles. The reason for this is that since the candle has not closed yet, the MA’s will still be influenced by price action.
MACD
MACD stands for Moving Average Convergence Divergence and its definition, according to Investopedia, is:
Moving average convergence divergence (MACD) is a trend-following momentum indicator that shows the relationship between two moving averages of a security’s price. The MACD is calculated by subtracting the 26-period exponential moving average (EMA) from the 12-period EMA.
The result of that calculation is the MACD line. A nine-day EMA of the MACD called the “signal line,” is then plotted on top of the MACD line, which can function as a trigger for buy and sell signals. Traders may buy the security when the MACD crosses above its signal line and sell — or short — the security when the MACD crosses below the signal line. Moving average convergence divergence (MACD) indicators can be interpreted in several ways, but the more common methods are crossovers, divergences, and rapid rises/falls.
Below you can see an example of MACD for BTC on 30 minute timeframe:
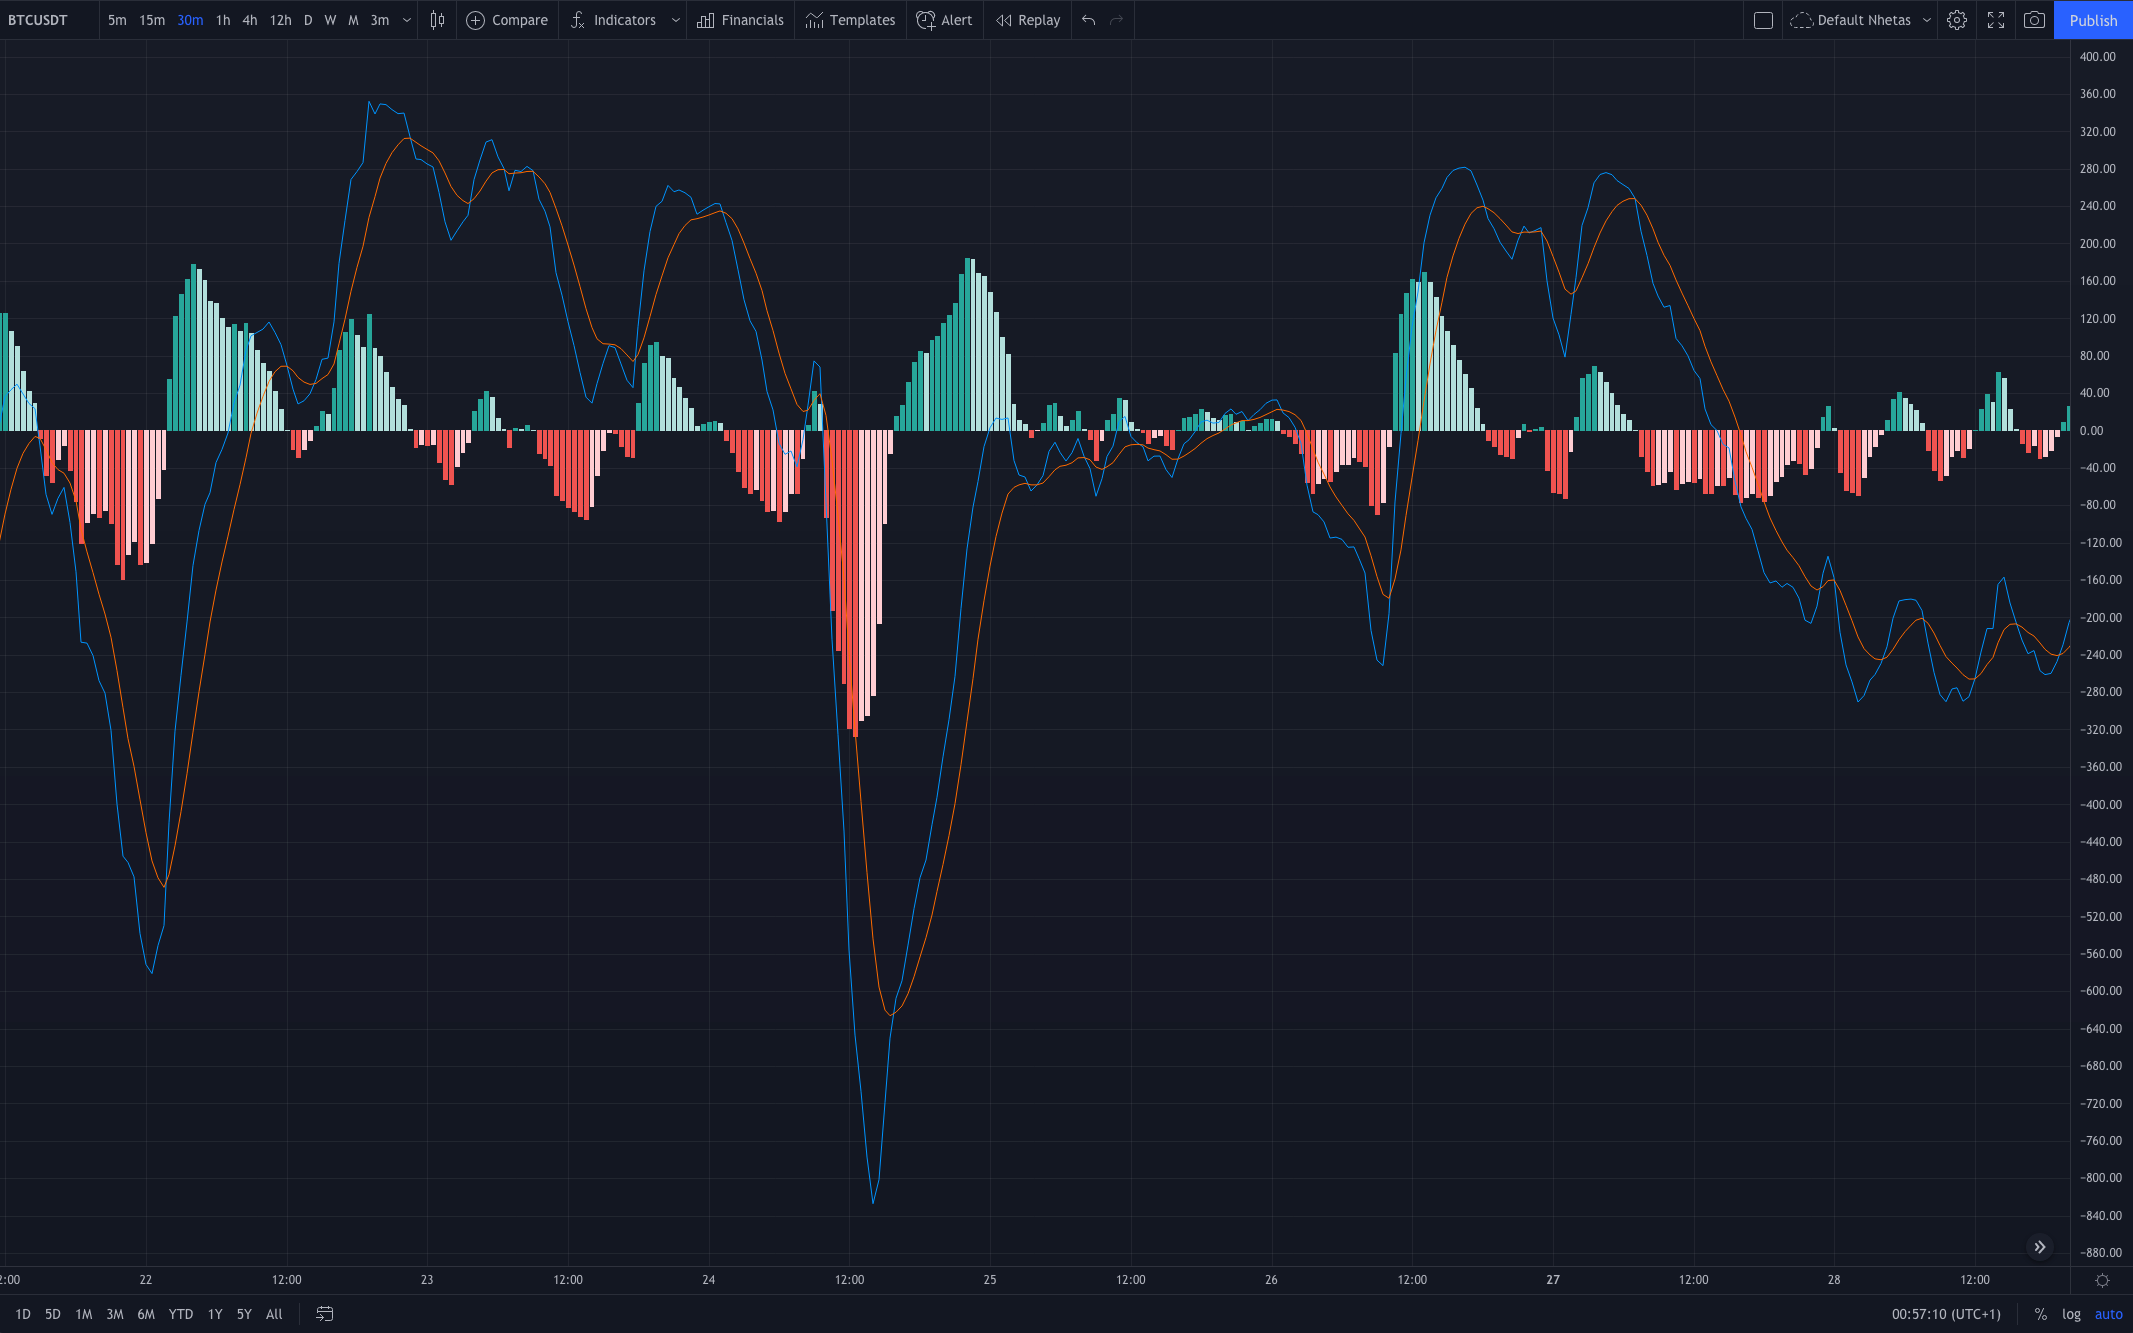
As with the previous indicators, MACD also assists us in deciding when to enter and when to exit a trade.
Bellow some key points:
- Blue line crossing over red line -> Bullish
- Red line crossing over blue line -> Bearish
- Histogram Bars are dark green -> Uptrend
- Histogram Bars are light green -> Uptrend is losing strength, and probably you can already see price decreasing.
- Histogram Bars are dark red -> Downtrend
- Histogram Bars are light red -> Downtrend is losing strength, and probably you can already see price increasing.
My usual approach to the MACD chart is to look for the lines crossing and then refer to the histogram to see if the trend is still gaining strength.
Bollinger Bands
Bollinger Bands are known as volatility indicators.
According to Investopedia, Bollinger Bands can be defined as:
A Bollinger Band® is a technical analysis tool defined by a set of trend-lines plotted two standard deviations (positively and negatively) away from a simple moving average (SMA) of a security’s price, but which can be adjusted to user preferences.
There are three lines that compose Bollinger Bands: A simple moving average (middle band) and an upper and lower band.
The upper and lower bands are typically 2 standard deviations +/- from a 20-day simple moving average, but can be modified.
See below an example of Bollinger Bands applied to BTC on a 30 minute timeframe:
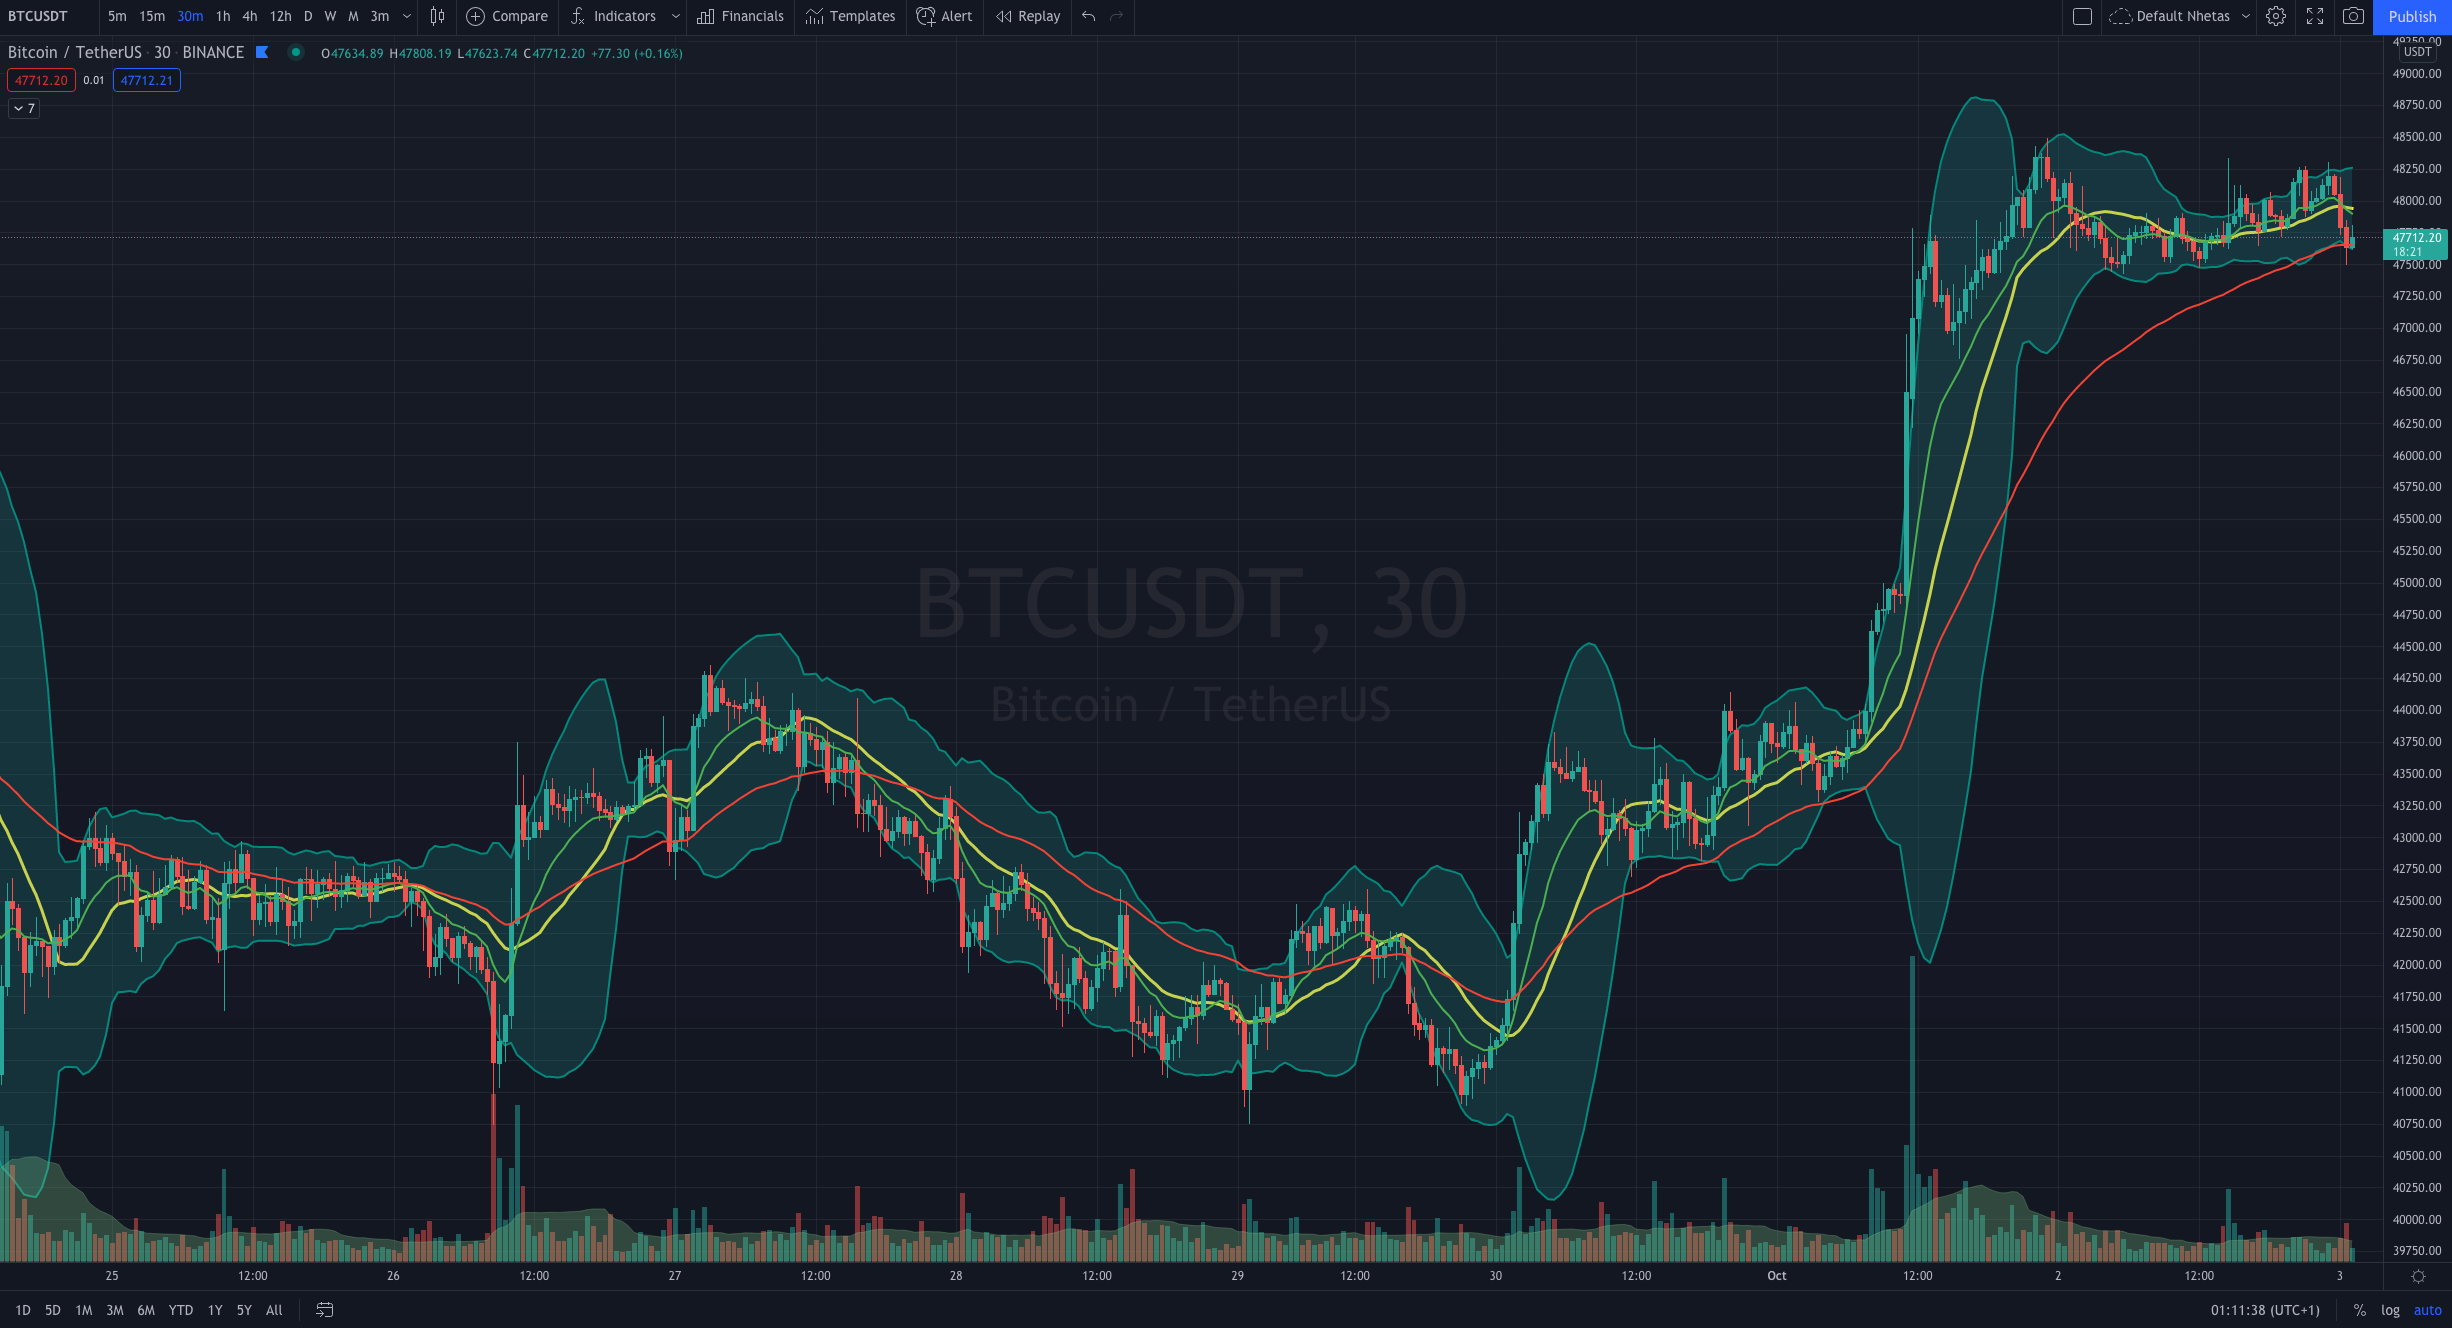
The reason why I say that it is a volatility indicator is that the tighter the bands get, the less volatility a coin has.
Also, the tighter the bands get, the more likely it is that a breakout will soon occur.
Some basic key points are:
- When a candle breaks the lower band, it is an oversell sign, you should go long. (If this is true after the candle closes).
- When a candle breaks the upper band, it is an overbuy sign, you should go short. (If this is true after the candle closes).
- When a coin has been trading below the SMA and has a candle closing above it, this is a bullish sign.
- When a coin has been trading above the SMA and has a candle closing below it, this is a bearish sign.
Conclusion
Although there are many more indicators used in technical analysis, I have found that by using these 4 together, I have been able to make decent profits and also reduce my losses.
Hope the information you just read was clear, I tried to explain them in a short way as I see no need to dig in deeper when a couple of key points are all you need to start taking advantage of these tools.
I am also adding below an example of these 4 indicators used together to showcase a possible trade.

As you will see, there were other points where I could have decided to enter or exit a trade, but almost all of them would still turn out to be a profitable trade.
Sources
All images added here were taken from historical BTC data from Tradingview.
Technical Analysis indicators definitions were taken from Investopedia.