



After weeks of steady decline, Shiba Inu has shown a slight but noteworthy recovery, with the well-known meme asset rising by about 1.7% during the most recent trading session. The move is notable because it came after a protracted period of diminishing momentum and almost constant selling pressure, even though it is insufficient to change SHIB’s overall bearish trend.
SHIB has recovered from local lows set earlier in July and is currently trading at about $0.0000114. The rebound occurs as the token makes an effort to hold steady above a crucial support area that has drawn buyers on multiple occasions over the previous few weeks. Technically speaking, the shift seems to be motivated more by seller fatigue than by aggressive new purchases.
SHIB is still below all significant moving averages, according to the chart. The long-term market structure is still bearish because the 50-day EMA is close to $0.0000118 and the 100-day and 200-day trend indicators are still significantly higher. Nonetheless, a number of indicators suggest that the downward momentum has started to wane. The RSI is now getting close to the 42 level after recovering from oversold territory.
This shows that selling pressure is no longer controlling the market to the same extent as it was in June and early July, even though it is still below neutral. The concept of stabilization is also supported by volume dynamics. Speculative mania is not driving the current rebound because trading activity has not skyrocketed. Rather, SHIB seems to be establishing a short-term base following a protracted decline. Overhead resistance continues to be the largest obstacle for bulls.
You Might Also Like

The $0.0000118 and $0.0000120 resistance levels have now turned into resistance zones. A successful move above those levels could pave the way for the 100-day moving average and would be buyers’ first significant technical victory in months.
On the downside, SHIB would soon be vulnerable to another test of recent lows if support were not maintained at current levels. Traders should not assume that a single green session signals the start of a more significant trend reversal, due to the asset’s propensity for extreme volatility.
Ethereum Yet to Be Tested
As the second-largest cryptocurrency continues to recover from the severe June sell-off, Ethereum is getting close to what might be its most significant resistance test in recent months. ETH has risen back toward the $1,900 area after recovering from lows close to $1,550, putting it squarely below a significant technical barrier that may decide whether a move toward $2,000 materializes.
Ethereum is currently trading at about $1,870 and has established a series of higher highs and higher lows throughout July. Growing momentum and a successful recovery of the 50-day and 100-day moving averages have bolstered this comeback. Bulls now have a stronger base than they did a few weeks ago because the 50-day EMA around $1,796 and the 100-day EMA around $1,732 have moved into support. The most significant obstacle is still ahead.
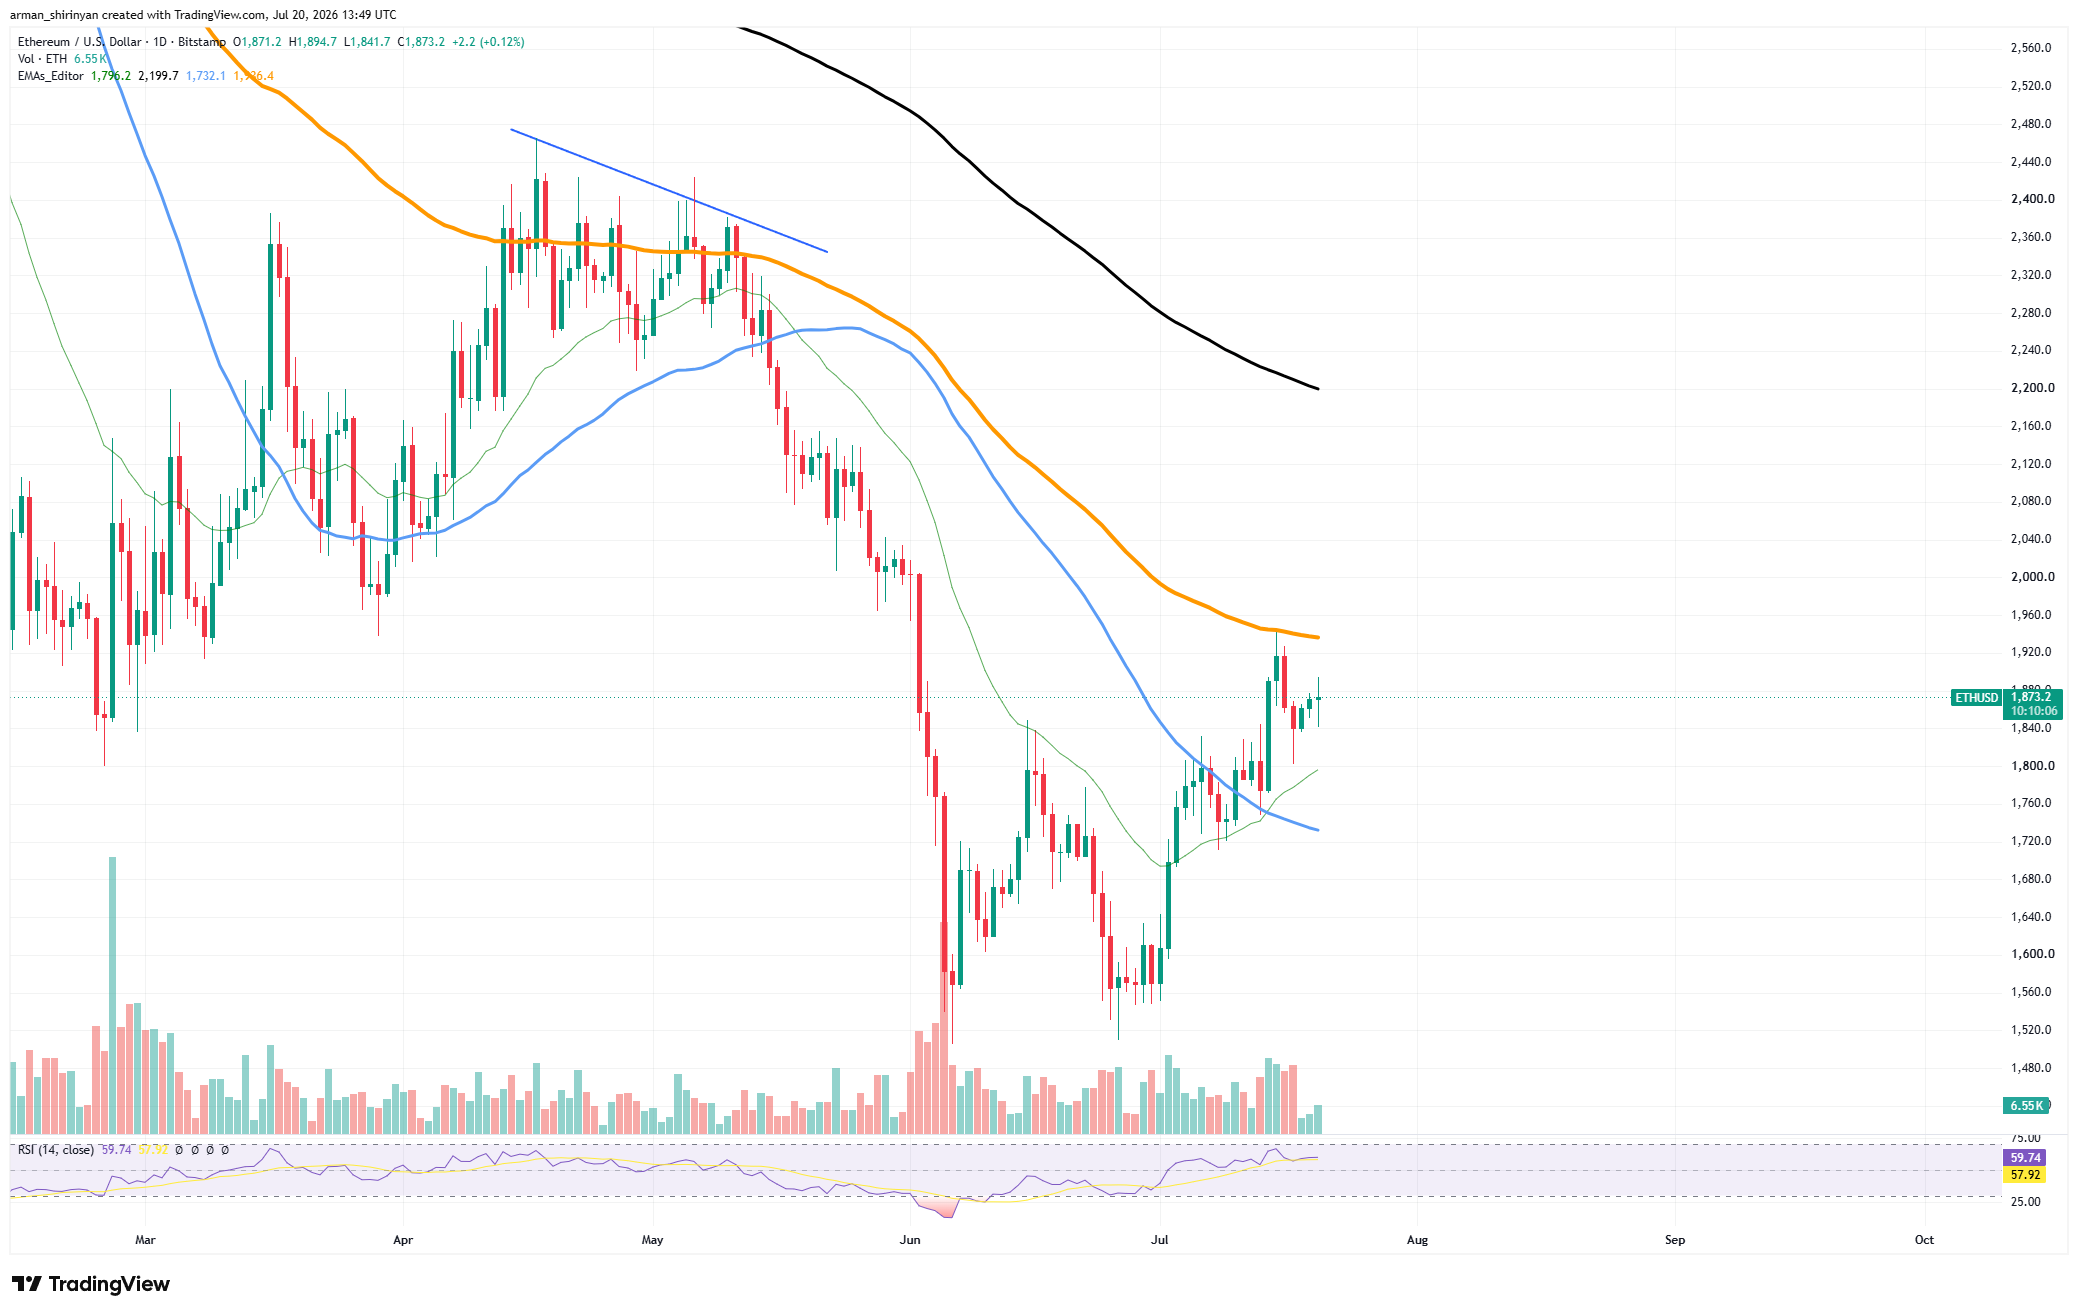
The 200-day moving average for Ethereum is currently being tested close to $1,936, a level that has frequently served as resistance throughout 2025. This region is more significant than just a moving average. Additionally, ETH would return above a crucial psychological threshold and greatly improve market sentiment if it broke above the 200-day trend line. The current price structure indicates a rise in buyer aggression.
Despite sporadic profit-taking, Ethereum formed a robust V-shaped recovery after the capitulation event in June and has continued to push higher. Throughout the advance, trading volume has stayed high, suggesting real participation as opposed to a purely speculative bounce.
You Might Also Like
Momentum metrics lend credence to the bullish argument. The RSI has increased to about 60, indicating that demand is getting stronger, while it is still below overbought territory. In the event that resistance starts to wane, this allows for another leg higher.
The $2,000 level, which is still the next important psychological and technical target, would probably be reached with a clear close above $1,936. If the price breaks above $2,000, more momentum buying may occur, forcing sidelined investors to return to the market. Failure at current levels, though, might cause a brief decline toward support at $1,800. Such a move would postpone Ethereum’s attempt to recover one of the most significant price levels in the market, even though it would not necessarily invalidate the recovery.
Bitcoin’s Momentum Is There
After recovering from its dramatic June correction, Bitcoin is quietly gaining momentum. The current technical structure indicates that the market still has room to rise before running into significant resistance. As buyers continue to defend higher lows, the path toward $68,000 seems more plausible, with Bitcoin currently trading at $64,600.
Bitcoin’s successful comeback above the 50-day and 100-day moving averages is the chart’s most significant development. In contrast to the market structure observed only a few weeks ago, the 50-day EMA near $63,700 and the 100-day EMA around $63,100 are now functioning as support rather than resistance.
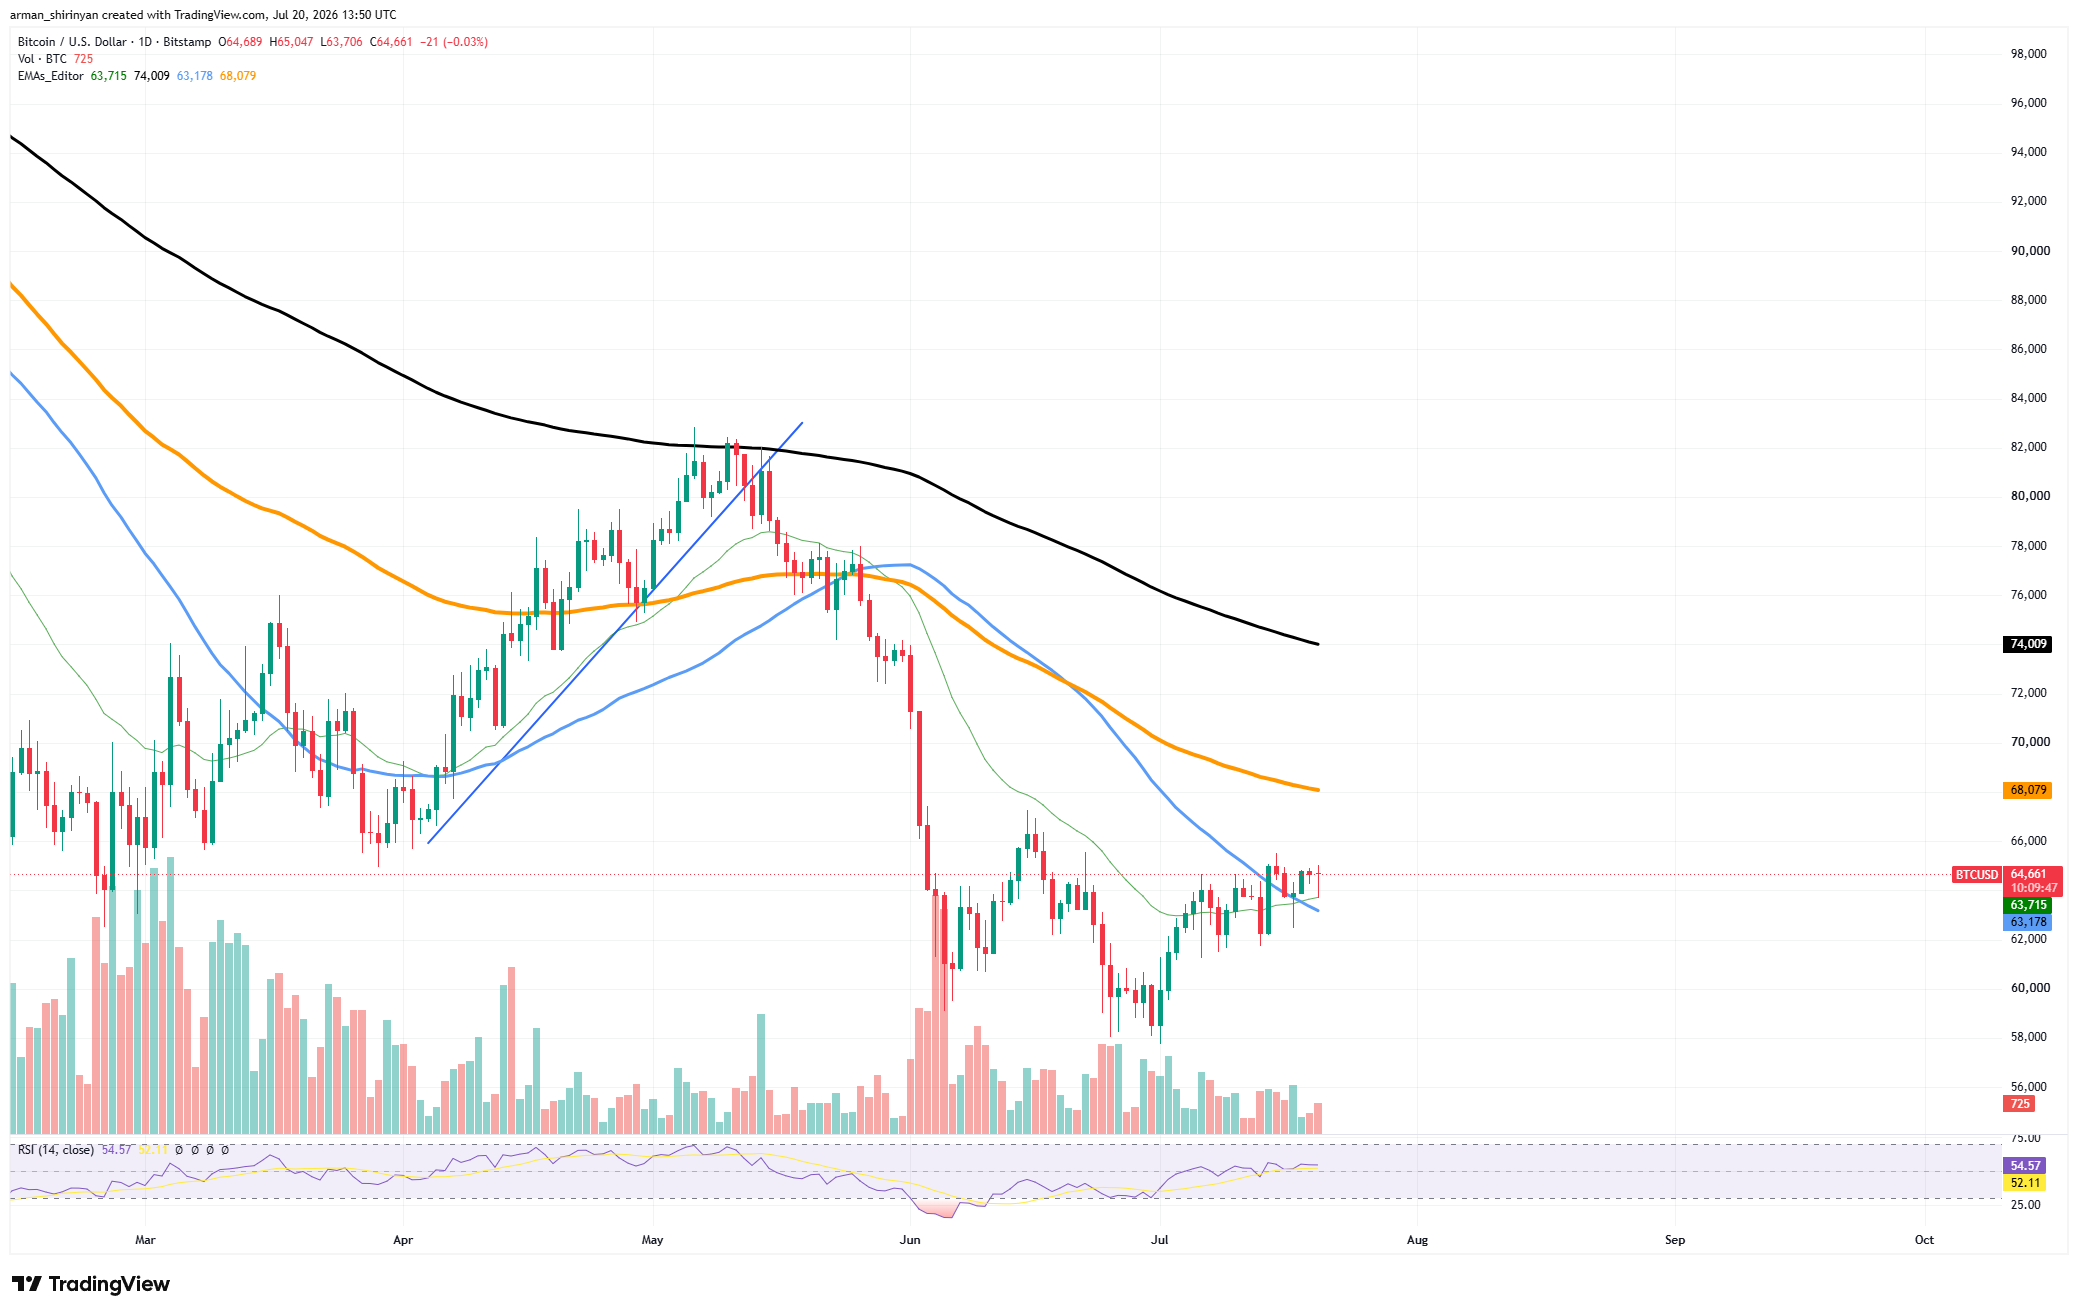
After Bitcoin briefly fell below $60,000 due to a sharp sell-off, buyers intervened forcefully, setting off a series of higher lows. The recovery has been gradual rather than rapid, which frequently provides a stronger basis for long-term upward movement. Technically speaking, the next major barrier does not appear until the $68,000 range.
This region is in line with the 200-day moving average, which is currently close to $68,100. Traders are likely to see this zone as the first significant test for the continuing recovery, since long-term trend indicators frequently attract significant selling activity. The bullish argument is still supported by momentum indicators.
You Might Also Like

The RSI has increased above 54, indicating that demand is improving without entering overbought territory. This is significant because it implies that Bitcoin still has potential to grow before its momentum becomes stretched.
Following the June panic, volume has also stabilized, suggesting that the market is no longer going through the aggressive liquidation phase that defined the previous decline. Rather, as confidence reappears, participants seem to be progressively rebuilding their positions. But the overall trend is still uneven.
Even though the short-term outlook has significantly improved, Bitcoin is still far from the highs set earlier in the year and is still trading below its 200-day moving average. Bulls must demonstrate that the current comeback is more than just a passing rally. Technically, a move toward $68,000 seems warranted if the current support levels hold.
Reclaiming the 200-day trend line could significantly boost market sentiment and bolster the case for a more significant recovery during the second half of the year, making such a rally a crucial turning point. With $68,000 emerging as the next significant target, Bitcoin’s chart currently indicates that the market still has unresolved business to the upside.
