• Latest
  • Trending
The Market’s Compass US Index and Sector ETF Study

The Market’s Compass US Index and Sector ETF Study

December 6, 2025
Ripple, XRP Won: SEC Lawsuit Filed This Date 5 Years Ago

Ripple, XRP Won: SEC Lawsuit Filed This Date 5 Years Ago

December 6, 2025
Best AI Stocks to Buy Now for the Long Term

Best AI Stocks to Buy Now for the Long Term

December 6, 2025
Kraken expands access in Colombia with local payment integration

Kraken expands access in Colombia with local payment integration

December 6, 2025
Crypto Tailwinds on Tap: Coinbase

Crypto Tailwinds on Tap: Coinbase

December 6, 2025
Binance Launches ‘Binance Junior,’ a First-of-Its-Kind Crypto Savings App for Kids and Teens Worldwide

Binance Launches ‘Binance Junior,’ a First-of-Its-Kind Crypto Savings App for Kids and Teens Worldwide

December 6, 2025
Arclaim Lands $5M Funding to Solve Staking’s Liquidity Challenges

Arclaim Lands $5M Funding to Solve Staking’s Liquidity Challenges

December 6, 2025
Western Union to Launch Stable Card, Issue Its Own Coin

Western Union to Launch Stable Card, Issue Its Own Coin

December 6, 2025
Internet Computer (ICP) crashes to $3.50 as AI hype fades and market pressure mounts

Internet Computer (ICP) crashes to $3.50 as AI hype fades and market pressure mounts

December 6, 2025
$68.67 Million in Minutes: Tom Lee’s BitMine Buys Ethereum Again

$68.67 Million in Minutes: Tom Lee’s BitMine Buys Ethereum Again

December 6, 2025
  • Privacy Policy
Saturday, December 6, 2025
MtRushmoreCrypto - Where Crypto Rocks
  • Home
  • Top News
  • Crypto
  • Crypto Technical Analysis
  • About Us
  • Crypto Vouchers
  • Cryptocurrency and ANKR Price Prediction
  • Cosmos cryptocurrency price prediction
No Result
View All Result
  • Home
  • Top News
  • Crypto
  • Crypto Technical Analysis
  • About Us
  • Crypto Vouchers
  • Cryptocurrency and ANKR Price Prediction
  • Cosmos cryptocurrency price prediction
No Result
View All Result
Logo
No Result
View All Result
Home Crypto

The Market’s Compass US Index and Sector ETF Study

J_News by J_News
December 6, 2025
in Crypto, Top News
0
The Market’s Compass US Index and Sector ETF Study
0
SHARES
0
VIEWS
Share on FacebookShare on Twitter


Welcome to The Market’s Compass US Index and Sector ETF Study, Week #571. As always it highlights the technical changes of the 30 US Index and Sector ETFs that I track on a weekly basis and normally publish every third week. Past publications can be accessed by paid subscribers via The Market’s Compass Substack Blog.

Related articles

Ripple, XRP Won: SEC Lawsuit Filed This Date 5 Years Ago

Ripple, XRP Won: SEC Lawsuit Filed This Date 5 Years Ago

December 6, 2025
Best AI Stocks to Buy Now for the Long Term

Best AI Stocks to Buy Now for the Long Term

December 6, 2025

This week, in celebration of Thanksgiving, free subscribers will also receive this week’s entire Study in a not so veiled attempt to lure them to become paid subscribers.

To understand the methodology used in constructing the objective U.S. Index and Sector ETF Individual Technical Rankings visit the MC’s Technical Indicators page at www.themarketscompass.com and go to “us etfs”. What follows is a Cliff Notes version* of the full explanation…

*The technical ranking system is a quantitative approach that utilizes multiple technical considerations that include but are not limited to trend, momentum, measurements of accumulation/distribution and relative strength of each individual 30 U.S Index and Sector ETFs that can range between 0 and 50.

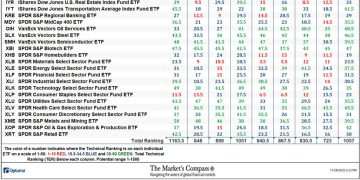
Total US ETF Ranking or “TER” rose sharply last week, rising +46.20% to 1057 from 723 which was the fifth week of declines in the “TER”.

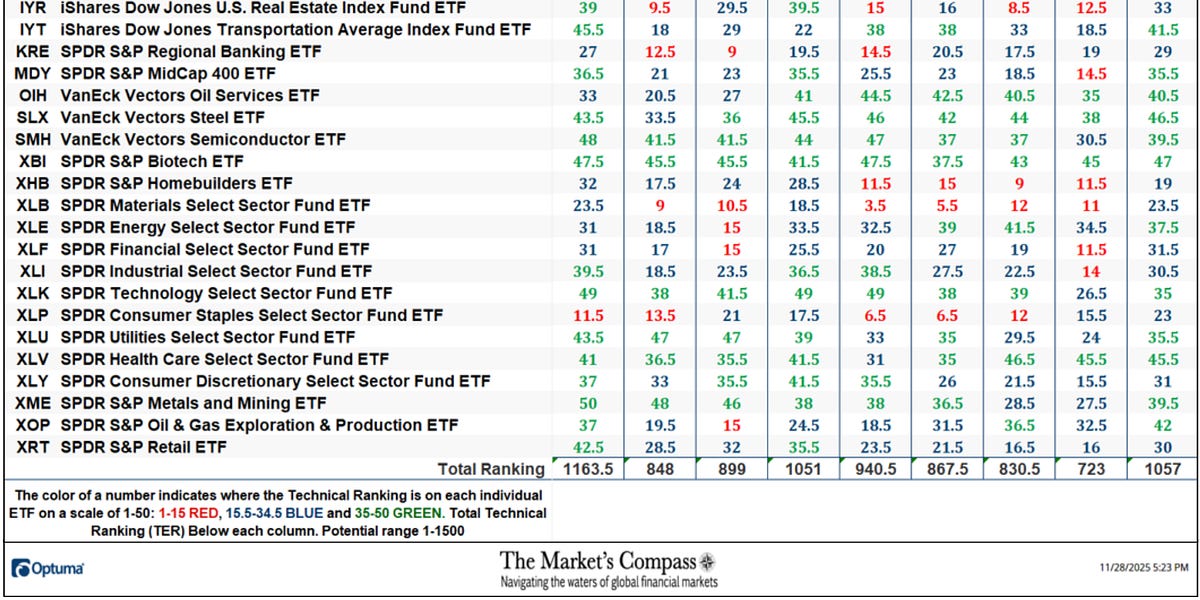
In a broad-based technical improvement of the thirty US ETFs we track twenty-nine showed gains in their Technical Rankings or “TR”, and one was unchanged. That was the SPDR Health Care Select Sector Fund ETF (XLV), but it should noted, despite being unchanged, its TR was nonetheless only just 4.5 points of near perfect. Fourteen ETFs made double-digit gains in their TRs. Sixteen ETF TRs ended the week in the “green zone” (TRs from 35 to 50) and fourteen ended in the “blue zone” (TRs from 15.5 to 34.5) vs. the previous week when there were only five in the “green zone”, seventeen in the “blue zone”, and eight were in the “red zone” (TRs between 0 and 15). Last week was the first time in four weeks when there wasn’t at least one TR in the “red zone”. The average TR gain on the week was +11.19 (the largest average TR gain in recent memory) vs. the week before average TR loss of -3.53.

*The Technical Condition Factors are derived from a calculation of the total Individual US Index and Sector ETF Technical Rankings. What is shown in the excel panel below is the total TCFs of all thirty TRs. A few TCFs carry more weight than the others, such as the Weekly Trend Factor and the Weekly Momentum Factor in compiling each individual TR of each of the 30 ETFs. Because of that, the excel sheet below calculates each factor’s weekly reading as a percentage of the possible total.

To fully understand the construction the of The Technical Condition Factors visit the MC’s Technical Indicators page at www.themarketscompass.com and go to “us etfs”.

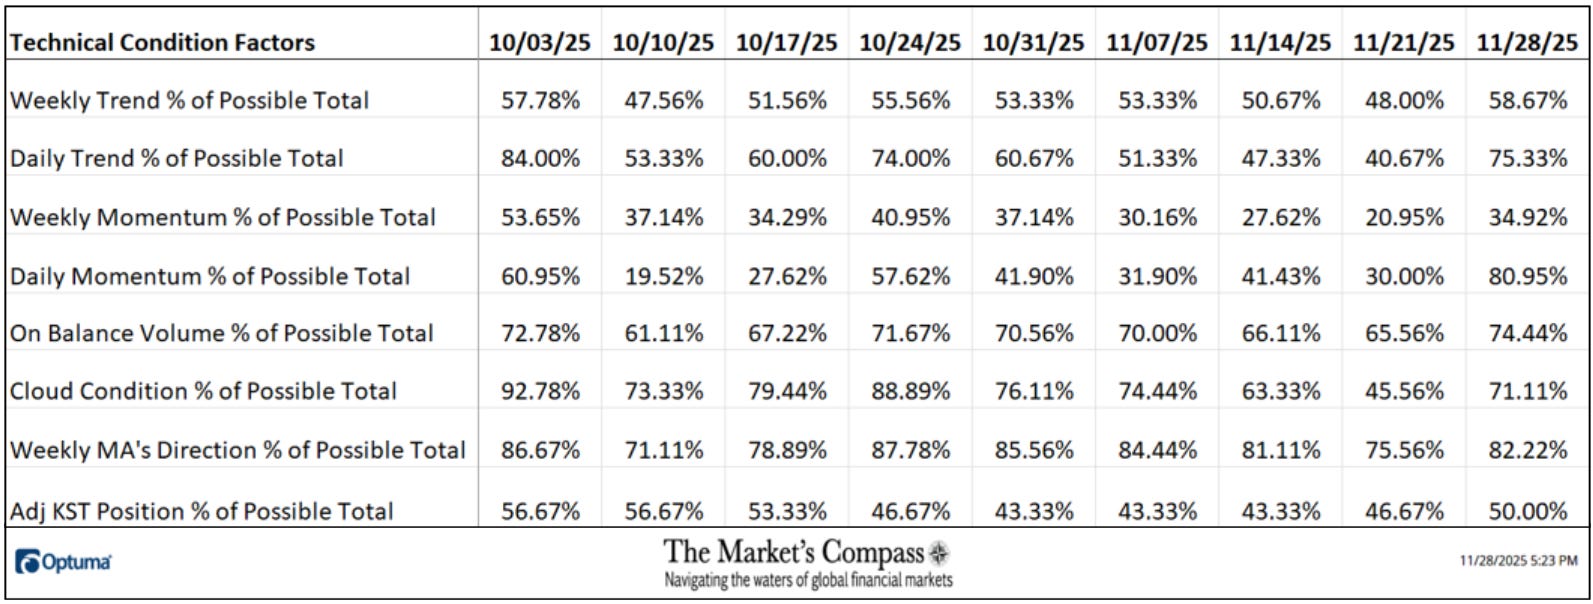
One technical takeaway would be for example, if the DMC Factor or DMCTF rises to an extreme between 85% and 100%, it would suggest a short-term overbought condition. Conversely, a reading in the range of 0% to 15% would suggest an oversold condition was developing. This past week a reading of 80.95% was registered in the DMCTF or 170 out of a total of 210 positive points, which was up from 30.00% the previous week.

As a confirmation tool, if all eight TCFs improve on a week over week basis, more of the 30 ETFs are improving internally on a technical basis confirming a broader market move higher (think of an advance/decline calculation). Conversely if all eight TCFs fell over the week it confirms a move lower in the broader market. Last week all eight TCFs gained ground confirming the broad-based rally in the S&P 500 Index.

The Total US ETF Technical Ranking (“TER”) Indicator is a total of all 30 ETF rankings and can be looked at as a confirmation/divergence indicator as well as an overbought oversold indicator.

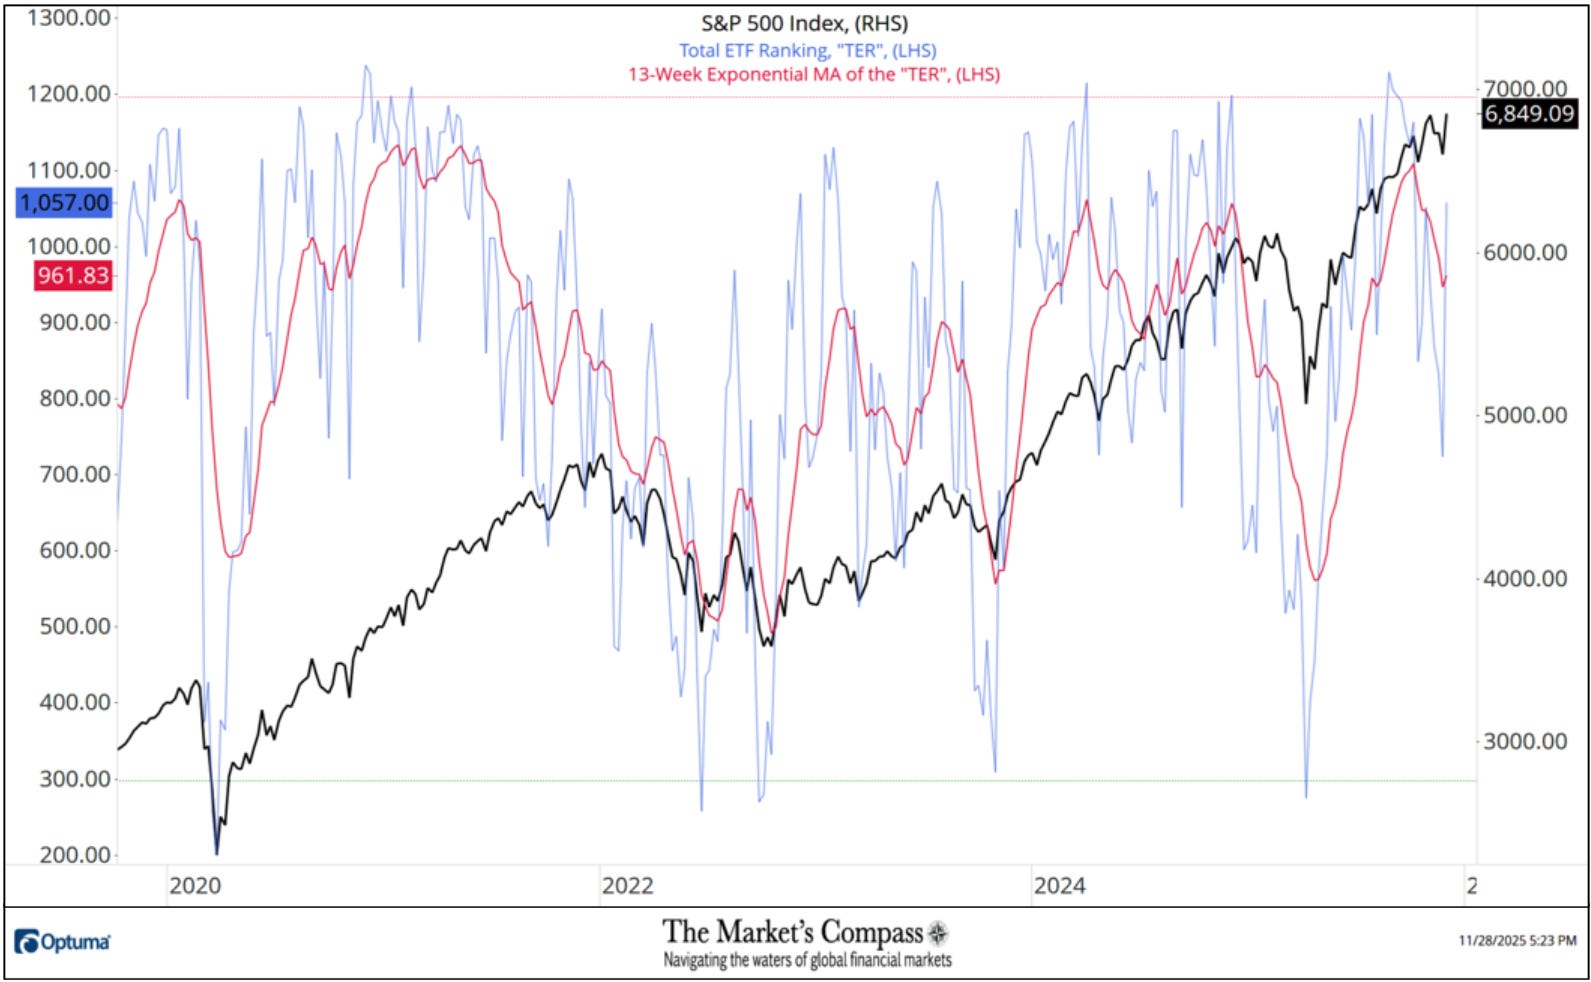
The S&P 500 Index rallied 3.73% last week to close at a new weekly closing high, thus avoiding a lower low and keeping the series of higher lows and higher highs on a weekly closing basis since April low intact. The Total US ETF Technical Ranking or “TER” rose sharply to a higher high to end the week at 1,057 confirming last week’s rally in the large cap index.

The Weekly Average Technical Ranking (“ATR”) is the average Technical Ranking of the 30 US Index and Sector ETFs we track. Like the TER, it is a confirmation/divergence as well as an overbought/oversold indicator.

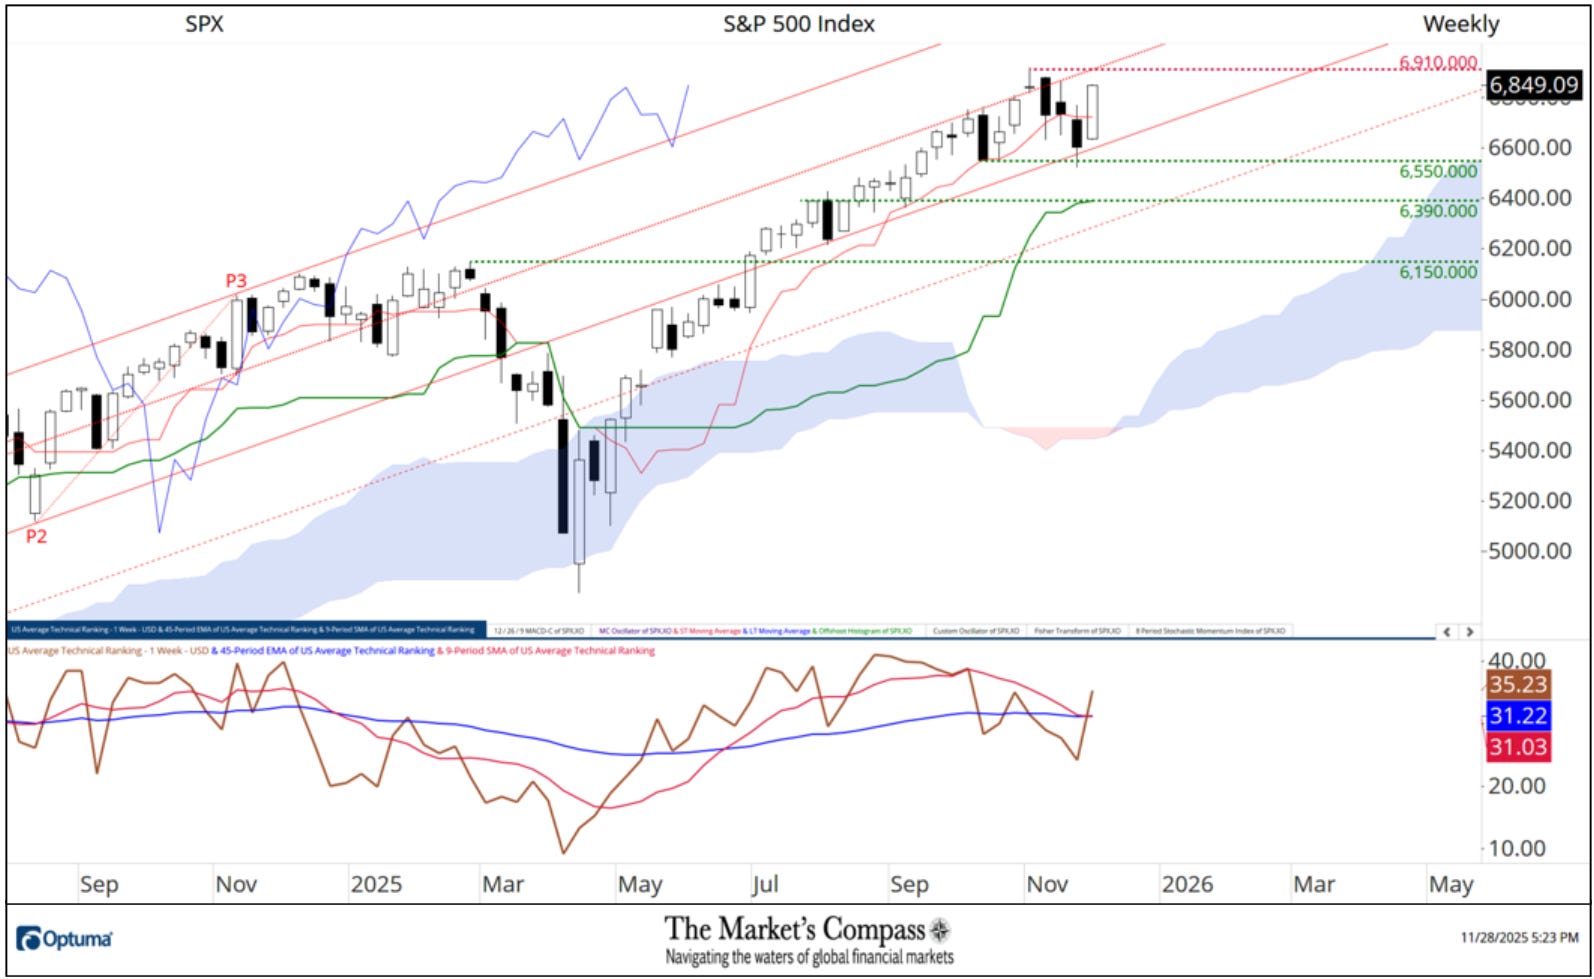
When I last published the US Index and Sector ETF Study on November 10th for the week ending November 7th, the SPX had pulled back at the Median Line (red dotted line) of the Standard Pitchfork* (red P1-P3). Two weeks ago the index fell and closed below the Tenkan Plot (red line) which had cradled prices on an weekly closing basis since early May but by the end of that week the Lower Parallel (solid line) held a further selloff and last week the SPX rallied impulsively, suggesting that short term correction from the record intra-week high at 6,910 had run its course. Like the Total Technical Ranking the “ATR” by rising from a lower low to a higher high in concert with the 9-Week SMA (red line in lower panel) avoiding a violation of the 45-Week EMA (blue line). These technical features point to a challenge of the Median Line and the all-time intra-week high at 6,910 in the weeks and perhaps days to come.

*An in-depth comprehensive lesson on Pitchforks is available on my website…

www.themarketscompass.com

*Does not include potential dividends if any

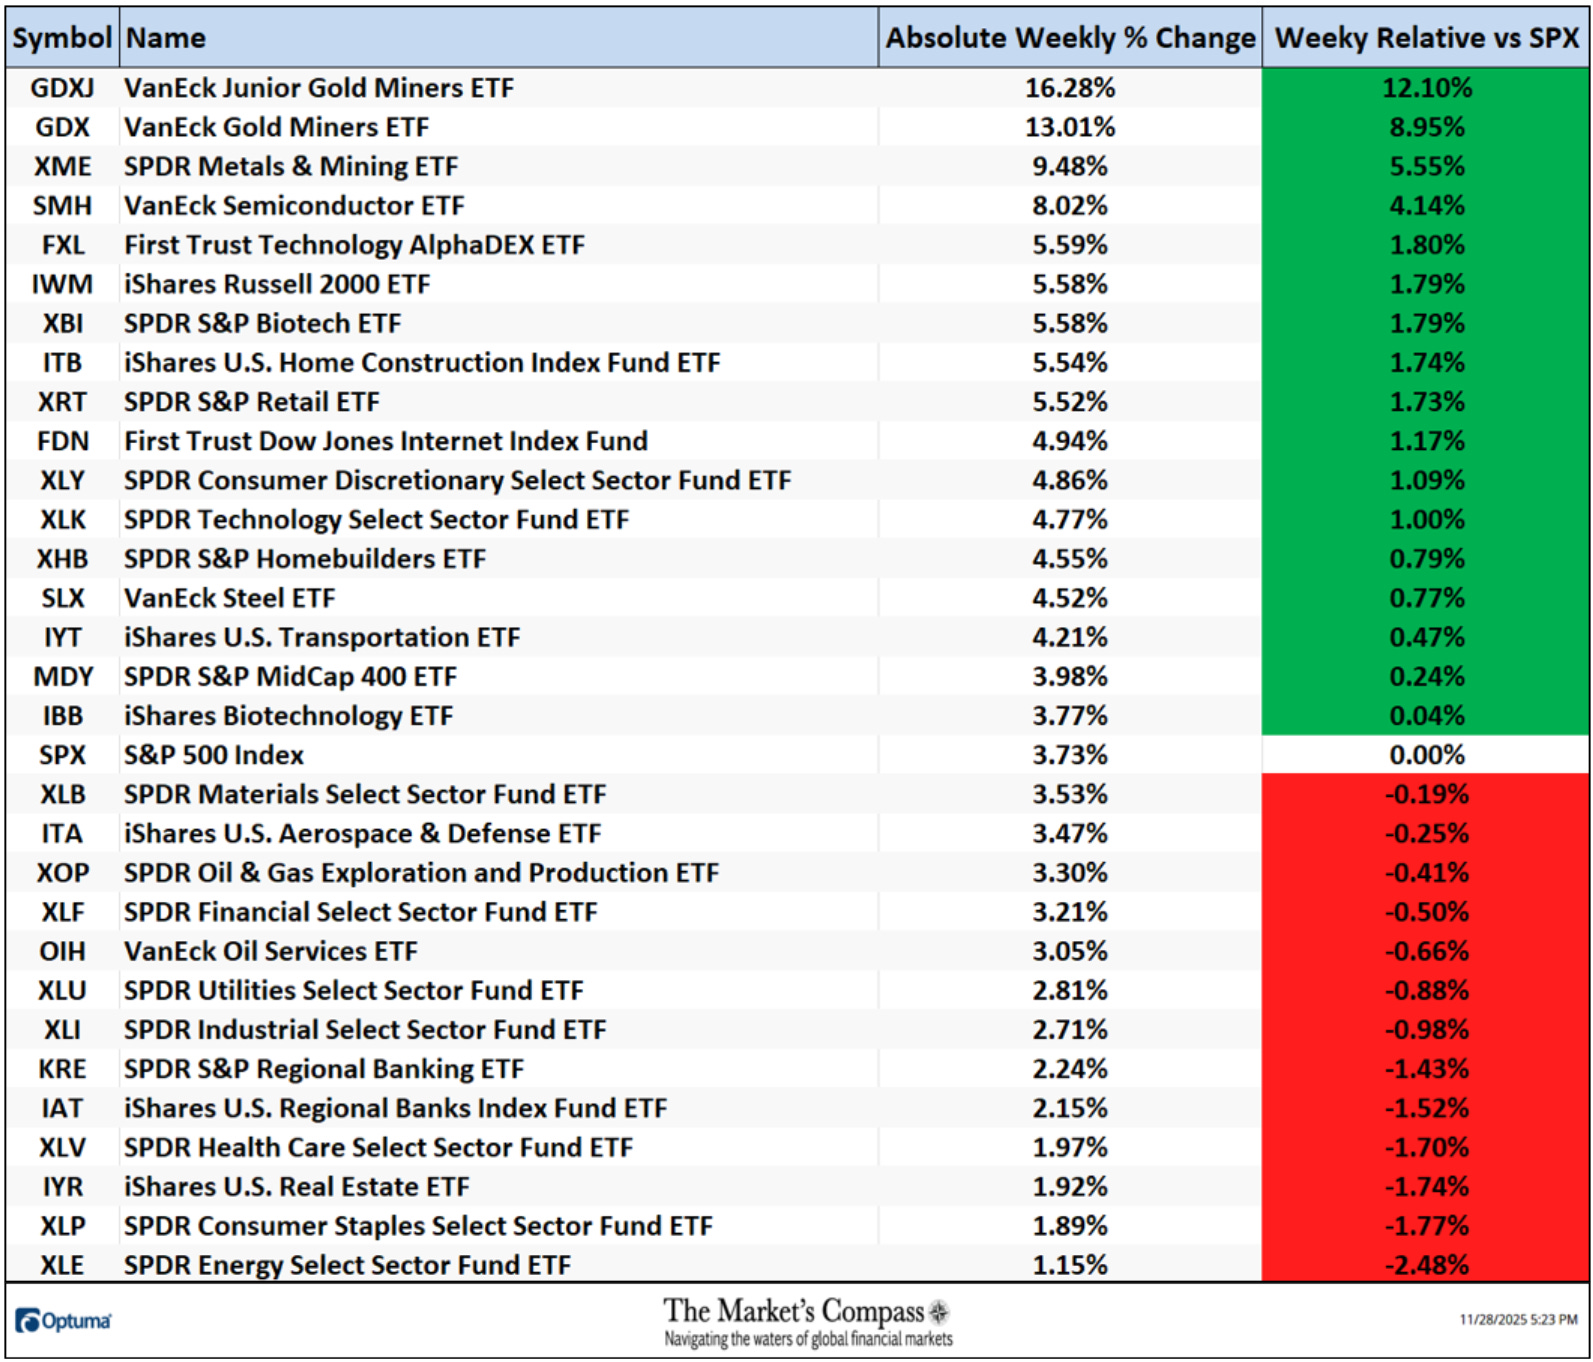
All thirty US Index and Sector ETFs we track in this Study gained ground on an absolute basis at the end of the holiday shortened week. Seventeen of the ETFs outperformed the +3.73% gain in the S&P 500 Index on a relative basis and thirteen underperformed. The standout gainers last week were gold and metals / mining ETFs. The average 4-Day absolute price gain last week was -4.79%, vs. the average absolute 5-Day loss the week before of -1.40%.

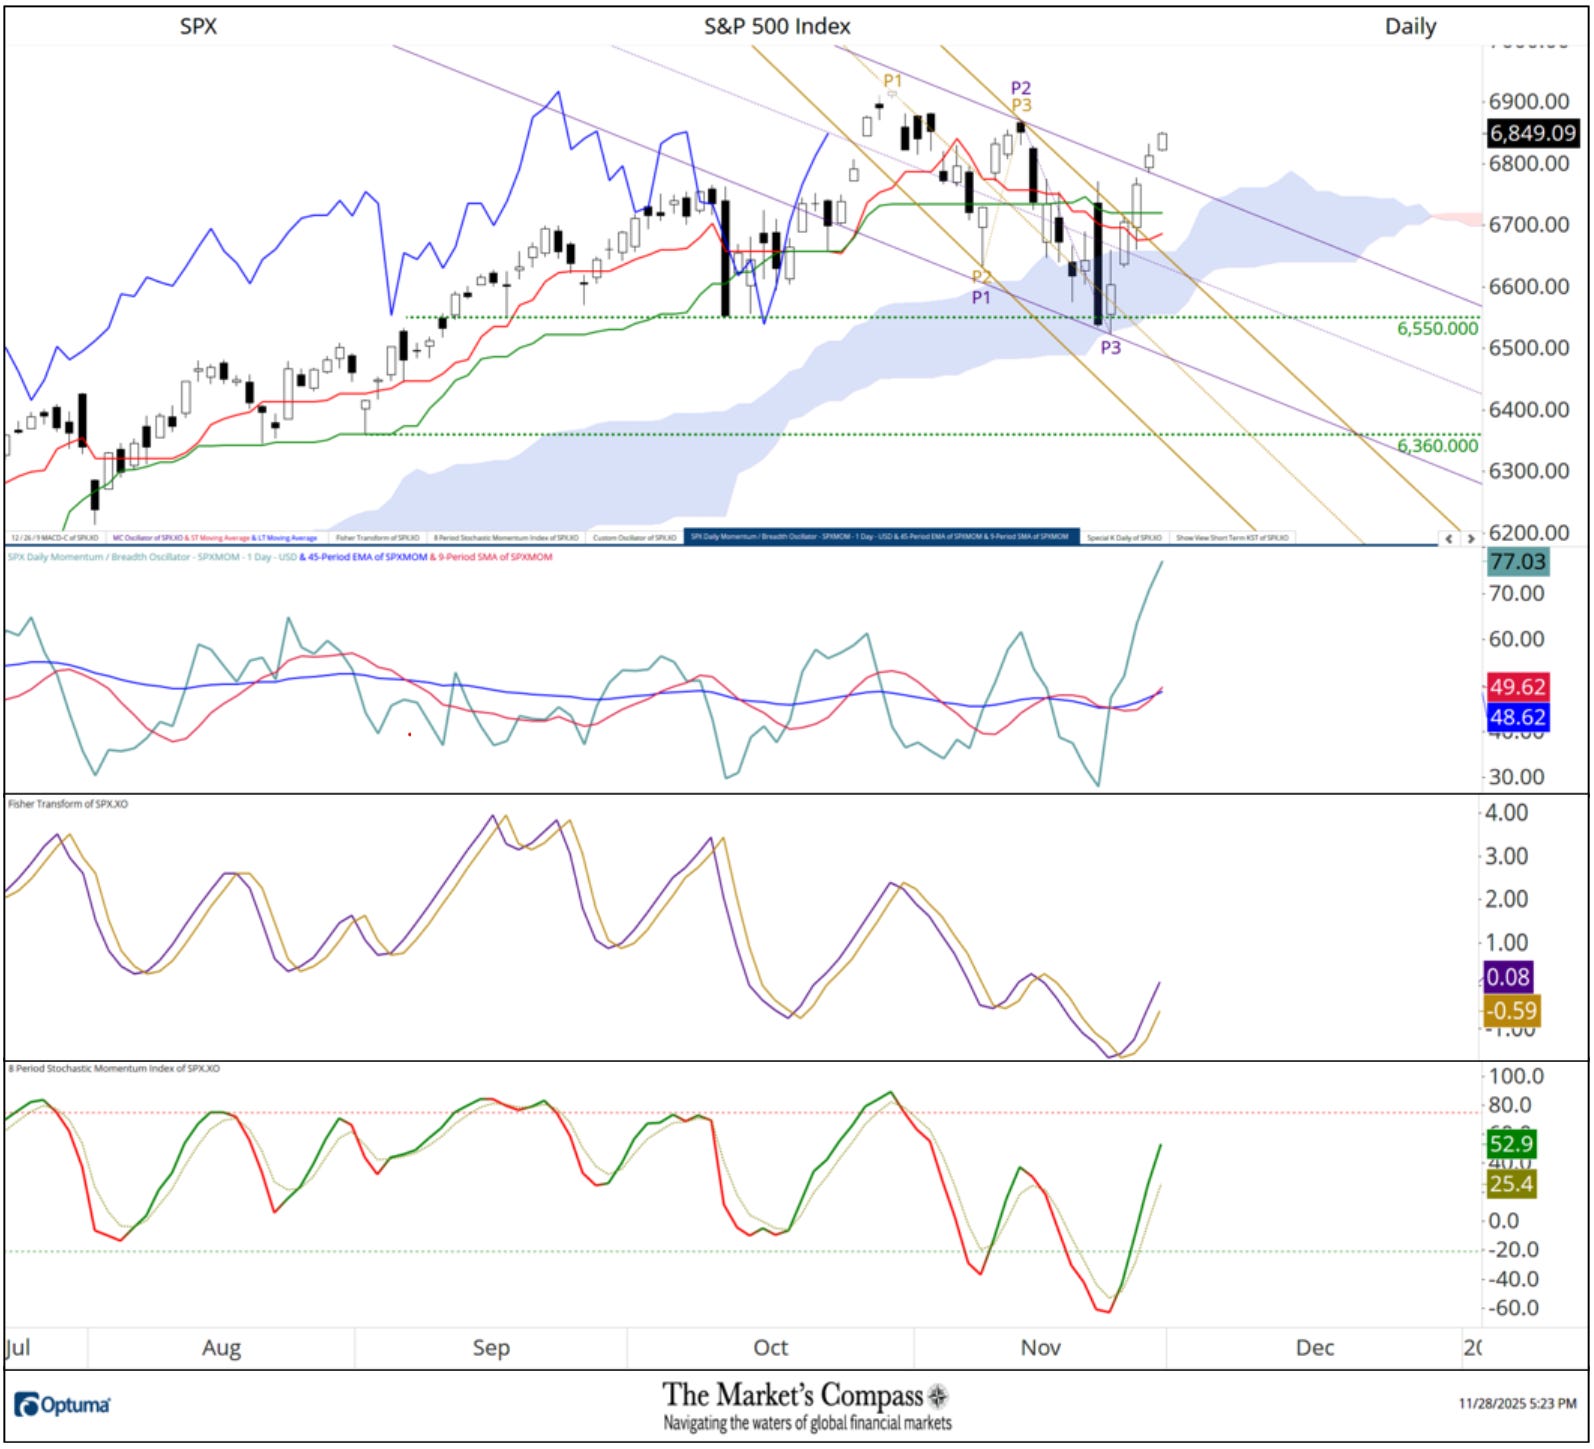
A week ago, last Friday, the SPX Index held support at the bottom of the Cloud respecting the oversold signal in all three oscillators and on Monday the large cap index retook the ground above the Cloud leading me to draw a second shorter-term Schiff Pitchfork (violet P1-P3). On Tuesday the SPX followed through to the upside again slicing through potential resistance at the Kijun Plot (green line) and the Upper Parallel (solid gold line) of the somewhat longer-term Standard Pitchfork (gold P1-P3) drawn from the all-time closing high. Last Wednesday the SPX rallied and closed above the Upper Parallel (solid violet line) of the newly drawn Schiff Pitchfork. The “icing on the cake” was yet another higher close at the end of the shortened trading session on Friday that came close to bettering the October 29th all-time closing high. I five trading days my SPX Daily Momentum / Breadth Oscillator (just below the price panel) has totally (and then some) the oversold condition. Although it signals a short-term overbought condition that my lead to a measure of “backing and filling” potentially testing support at the overtaken Upper Parallel it confirms the impulsive price move higher. That said the three wave ABC correction is likely complete with both the Fisher Transform and the Stochastic Momentum Index leaving nary a suggestion of an immediate decline.

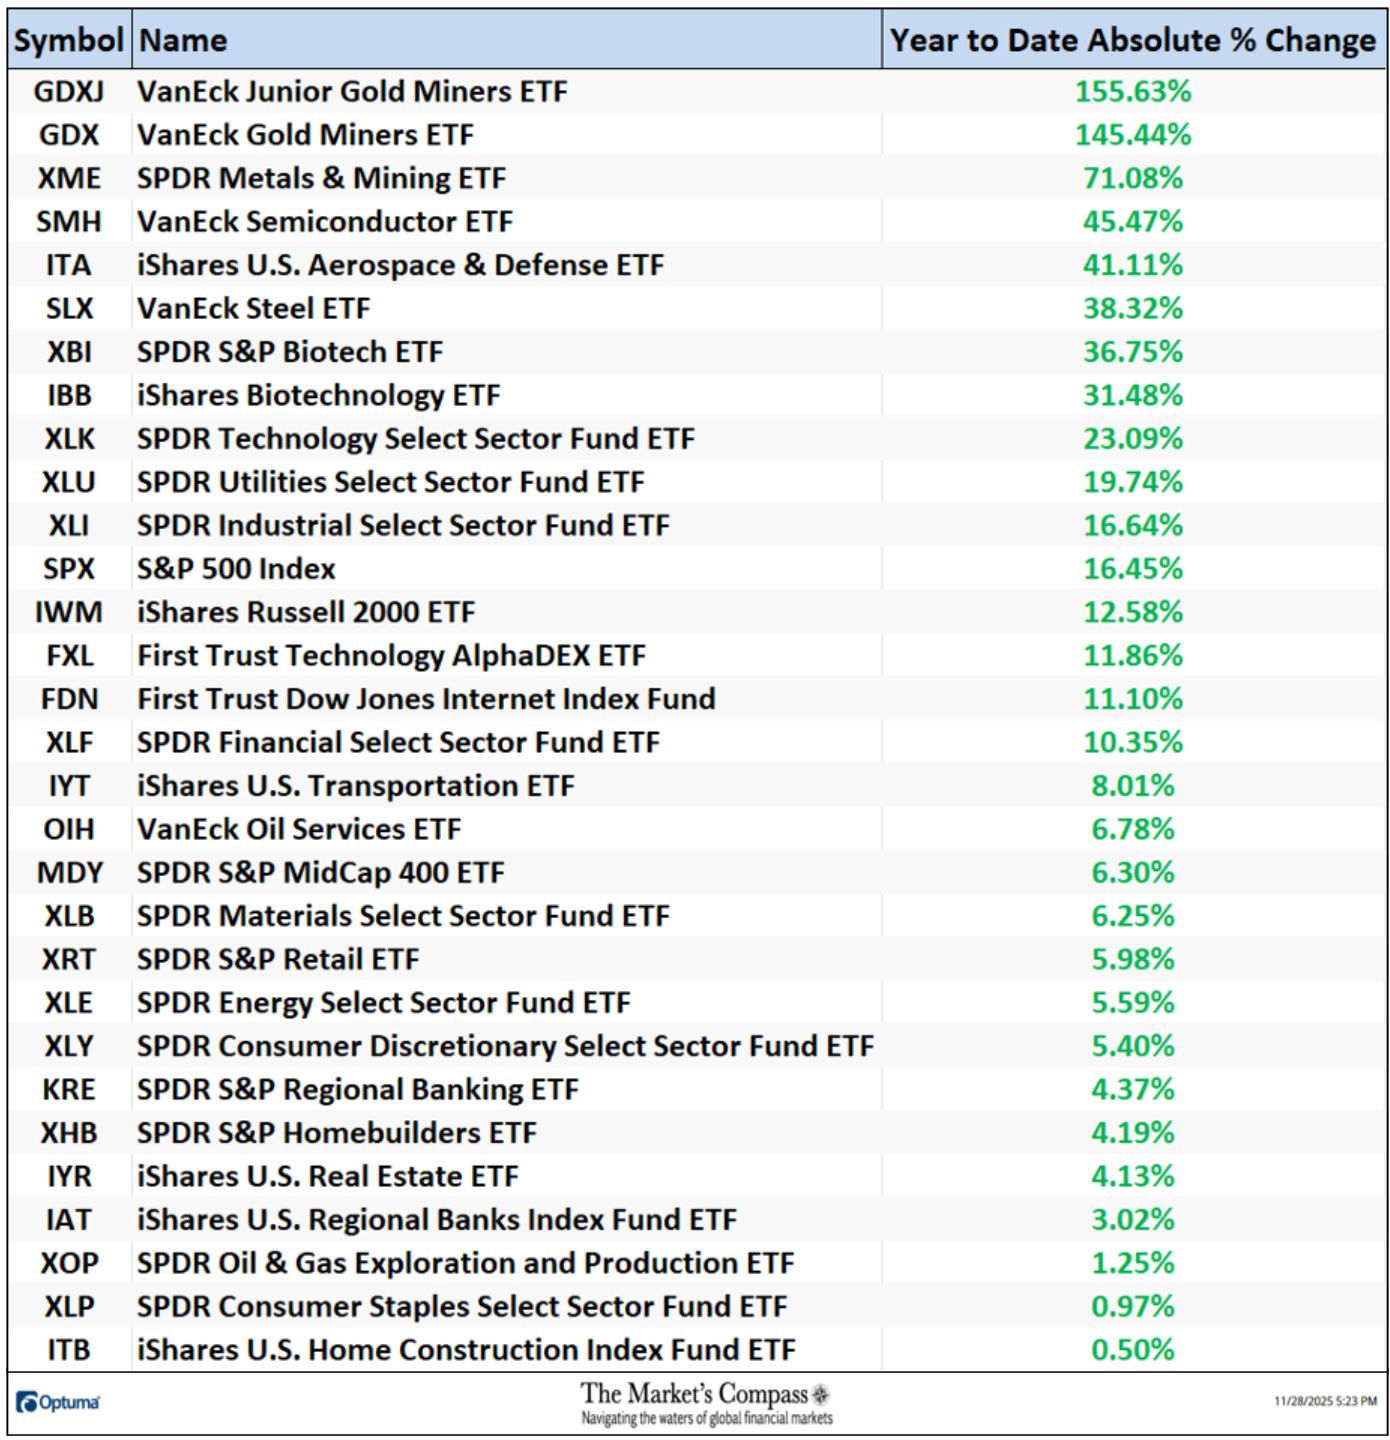
The YTD Average Absolute Price precentage gain jumped back to +25.29% from +18.63% last week.

For readers who are unfamiliar with the technical terms or tools referred to in the comments on the technical condition of the SPX can avail themselves of a brief tutorial titled, Tools of Technical Analysis and an in-depth comprehensive lesson on Pitchforks is available on my website…

www.themarketscompass.com

Charts are courtesy of Optuma whose charting software allows the Technical Rankings to be calculated and back tested.

To receive a 30-day trial of Optuma charting software go to…

www.optuma.com/TMC


Source link

ShareTweetShareShare

Related Posts

Ripple, XRP Won: SEC Lawsuit Filed This Date 5 Years Ago

Ripple, XRP Won: SEC Lawsuit Filed This Date 5 Years Ago

by J_News
December 6, 2025
0

The XRP community is doing a victory dance this December as the Ripple lawsuit filed by the SEC about five...

Best AI Stocks to Buy Now for the Long Term

Best AI Stocks to Buy Now for the Long Term

by J_News
December 6, 2025
0

TLDR Nvidia leads AI hardware with 114% revenue growth in Q3 2025, driven by Blackwell chip demand and strong analyst...

Kraken expands access in Colombia with local payment integration

Kraken expands access in Colombia with local payment integration

by J_News
December 6, 2025
0

We are excited to announce we are expanding services in Colombia through the activation of local payment rails. The introduction...

Crypto Tailwinds on Tap: Coinbase

Crypto Tailwinds on Tap: Coinbase

by J_News
December 6, 2025
0

Coinbase Institutional has said crypto markets may be poised for a December recovery, citing improving liquidity and a shift in...

Binance Launches ‘Binance Junior,’ a First-of-Its-Kind Crypto Savings App for Kids and Teens Worldwide

Binance Launches ‘Binance Junior,’ a First-of-Its-Kind Crypto Savings App for Kids and Teens Worldwide

by J_News
December 6, 2025
0

Key Takeaways:Binance unveils Binance Junior, a parent-controlled crypto savings app for users aged 6–17.The app offers simplified crypto experience with...

Load More

Enter your email address:

Delivered by FeedBurner

Quick Navigate

  • Home
  • Crypto
  • Crypto Technical Analysis
  • Top News
  • Thank You
  • Store
  • Crypto Vouchers
  • About Us
  • What Cryptocurrency Is and ANKR Price Prediction
  • Cosmos cryptocurrency price prediction

Top News

Top 10 NFTs to Watch in 2025 for High-Return Investments

Crypto Tailwinds on Tap: Coinbase

Japan Puts BTC in the Crosshairs of a Yen Carry Unwind

© 2021 mtrushmorecrypto - Crypto Related News Blog

We use cookies on our website to give you the most relevant experience by remembering your preferences and repeat visits. By clicking “Accept”, you consent to the use of ALL the cookies.
Do not sell my personal information.
Cookie SettingsAccept
Manage consent

Privacy Overview

This website uses cookies to improve your experience while you navigate through the website. Out of these, the cookies that are categorized as necessary are stored on your browser as they are essential for the working of basic functionalities of the website. We also use third-party cookies that help us analyze and understand how you use this website. These cookies will be stored in your browser only with your consent. You also have the option to opt-out of these cookies. But opting out of some of these cookies may affect your browsing experience.
Necessary
Always Enabled
Necessary cookies are absolutely essential for the website to function properly. These cookies ensure basic functionalities and security features of the website, anonymously.
CookieDurationDescription
cookielawinfo-checkbox-analytics11 monthsThis cookie is set by GDPR Cookie Consent plugin. The cookie is used to store the user consent for the cookies in the category "Analytics".
cookielawinfo-checkbox-functional11 monthsThe cookie is set by GDPR cookie consent to record the user consent for the cookies in the category "Functional".
cookielawinfo-checkbox-necessary11 monthsThis cookie is set by GDPR Cookie Consent plugin. The cookies is used to store the user consent for the cookies in the category "Necessary".
cookielawinfo-checkbox-others11 monthsThis cookie is set by GDPR Cookie Consent plugin. The cookie is used to store the user consent for the cookies in the category "Other.
cookielawinfo-checkbox-performance11 monthsThis cookie is set by GDPR Cookie Consent plugin. The cookie is used to store the user consent for the cookies in the category "Performance".
viewed_cookie_policy11 monthsThe cookie is set by the GDPR Cookie Consent plugin and is used to store whether or not user has consented to the use of cookies. It does not store any personal data.
Functional
Functional cookies help to perform certain functionalities like sharing the content of the website on social media platforms, collect feedbacks, and other third-party features.
Performance
Performance cookies are used to understand and analyze the key performance indexes of the website which helps in delivering a better user experience for the visitors.
Analytics
Analytical cookies are used to understand how visitors interact with the website. These cookies help provide information on metrics the number of visitors, bounce rate, traffic source, etc.
Advertisement
Advertisement cookies are used to provide visitors with relevant ads and marketing campaigns. These cookies track visitors across websites and collect information to provide customized ads.
Others
Other uncategorized cookies are those that are being analyzed and have not been classified into a category as yet.
SAVE & ACCEPT
No Result
View All Result
  • Home
  • Top News
  • Crypto
  • Crypto Technical Analysis
  • About Us
  • Crypto Vouchers
  • Cryptocurrency and ANKR Price Prediction
  • Cosmos cryptocurrency price prediction

© 2021 mtrushmorecrypto - Crypto Related News Blog