


Bitcoin has so far bounced above $90,000, 15% higher from its Nov. 21 low of around $80,000, with price finding confluence support across three important cost basis metrics: the 2024 yearly volume weighted cost basis, the True Market Mean, and the average U.S. spot exchange-traded fund (ETF) cost basis.


These metrics help to identify where investors are most likely to defend positions during drawdowns. The area of support proved vital, as it aligned closely with the average acquisition prices of multiple investor cohorts.
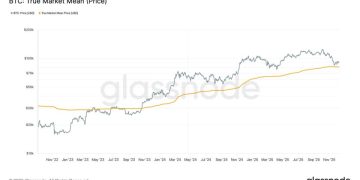
First, the True Market Mean, represents the average onchain purchase price of bitcoin held by active market participants. It focuses on coins that have moved recently, filtering out long dormant supply, and therefore reflects the cost basis of investors who are most likely to trade.
During this pullback, the True Market Mean sat near $81,000 and acted as clear support. Notably, bitcoin first moved above this level in October 2023 and had not traded below it since, reinforcing its importance as a structural bull market threshold.
Second, the U.S. spot ETF cost basis reflects the weighted average price at which bitcoin has flowed into U.S. listed spot ETFs. This is calculated by Glassnode using the combined daily ETF inflows with the market price.
The average cost basis currently sits around $83,844, according to Glassnode, and bitcoin once again bounced off this level, which it similarly did during the April tariff-driven selloff.
The third metric, the 2024 yearly cost basis, tracks the average price at which coins acquired in 2024 were withdrawn from exchanges. CoinDesk Research has shown a pattern that yearly cohort cost bases tend to act support during bull markets.
In this case, the 2024 cost basis near $83,000, according to checkonchain, provided additional confirmation of demand, again was also seen as support during the April correction.

These metrics highlight the depth of demand of support in the $80,000 region.