• Latest
  • Trending
The Market’s Compass US Index and Sector ETF Study

The Market’s Compass US Index and Sector ETF Study

December 22, 2025
212,479,300,000 SHIB: Key Shiba Inu Metric Says Demand Is Back

212,479,300,000 SHIB: Key Shiba Inu Metric Says Demand Is Back

February 7, 2026
Bitcoin’s Hidden Driver: The Inverse DXY Relationship

Bitcoin’s Hidden Driver: The Inverse DXY Relationship

February 7, 2026
The Market’s Compass Crypto Sweet Sixteen Study

The Market’s Compass Crypto Sweet Sixteen Study

February 7, 2026
SUP is available for trading!

SUP is available for trading!

February 7, 2026
Dapper Labs Ecosystem: Disney Pinnacle, NFL ALL DAY, and NBA Top Shot Drive Consumer Engagement on Flow

Dapper Labs Ecosystem: Disney Pinnacle, NFL ALL DAY, and NBA Top Shot Drive Consumer Engagement on Flow

February 7, 2026
BTC is seeing accumulation across all cohorts, according to Glassnode

BTC is seeing accumulation across all cohorts, according to Glassnode

February 7, 2026
Comparing Spartans, bet365, and Stake

Comparing Spartans, bet365, and Stake

February 7, 2026
HBAR surges 15% and XLM gains 10% as Bitcoin reclaims $70K

HBAR surges 15% and XLM gains 10% as Bitcoin reclaims $70K

February 7, 2026
Forget A Bitcoin Yearly Top, BTC Price Might Have Hit A 16-Year Cyclical Peak

Forget A Bitcoin Yearly Top, BTC Price Might Have Hit A 16-Year Cyclical Peak

February 7, 2026
  • Privacy Policy
Saturday, February 7, 2026
MtRushmoreCrypto - Where Crypto Rocks
  • Home
  • Top News
  • Crypto
  • Crypto Technical Analysis
  • About Us
  • Crypto Vouchers
  • Cryptocurrency and ANKR Price Prediction
  • Cosmos cryptocurrency price prediction
No Result
View All Result
  • Home
  • Top News
  • Crypto
  • Crypto Technical Analysis
  • About Us
  • Crypto Vouchers
  • Cryptocurrency and ANKR Price Prediction
  • Cosmos cryptocurrency price prediction
No Result
View All Result
Logo
No Result
View All Result
Home Crypto

The Market’s Compass US Index and Sector ETF Study

J_News by J_News
December 22, 2025
in Crypto, Top News
0
The Market’s Compass US Index and Sector ETF Study
0
SHARES
0
VIEWS
Share on FacebookShare on Twitter


Welcome to The Market’s Compass US Index and Sector ETF Study, Week #571. As always it highlights the technical changes of the 30 US Index and Sector ETFs that I track on a weekly basis and normally publish every third week. Past publications can be accessed by paid subscribers via The Market’s Compass Substack Blog*.

Related articles

212,479,300,000 SHIB: Key Shiba Inu Metric Says Demand Is Back

212,479,300,000 SHIB: Key Shiba Inu Metric Says Demand Is Back

February 7, 2026
Bitcoin’s Hidden Driver: The Inverse DXY Relationship

Bitcoin’s Hidden Driver: The Inverse DXY Relationship

February 7, 2026

*This week, in celebration of the Hanukkah and Christmas Holidays it is also being sent to free subscribers in a not so veiled attempt to lure them to become paid subscribers.

To understand the methodology used in constructing the objective U.S. Index and Sector ETF Individual Technical Rankings visit the MC’s Technical Indicators page at www.themarketscompass.com and go to “us etfs”. What follows is a Cliff Notes version* of the full explanation…

*The technical ranking system is a quantitative approach that utilizes multiple technical considerations that include but are not limited to trend, momentum, measurements of accumulation/distribution and relative strength of each individual 30 U.S Index and Sector ETFs that can range between 0 and 50.

Total US ETF Ranking or “TER” fell last week, dropping 7.85% to 1010 from 1096 the week before.

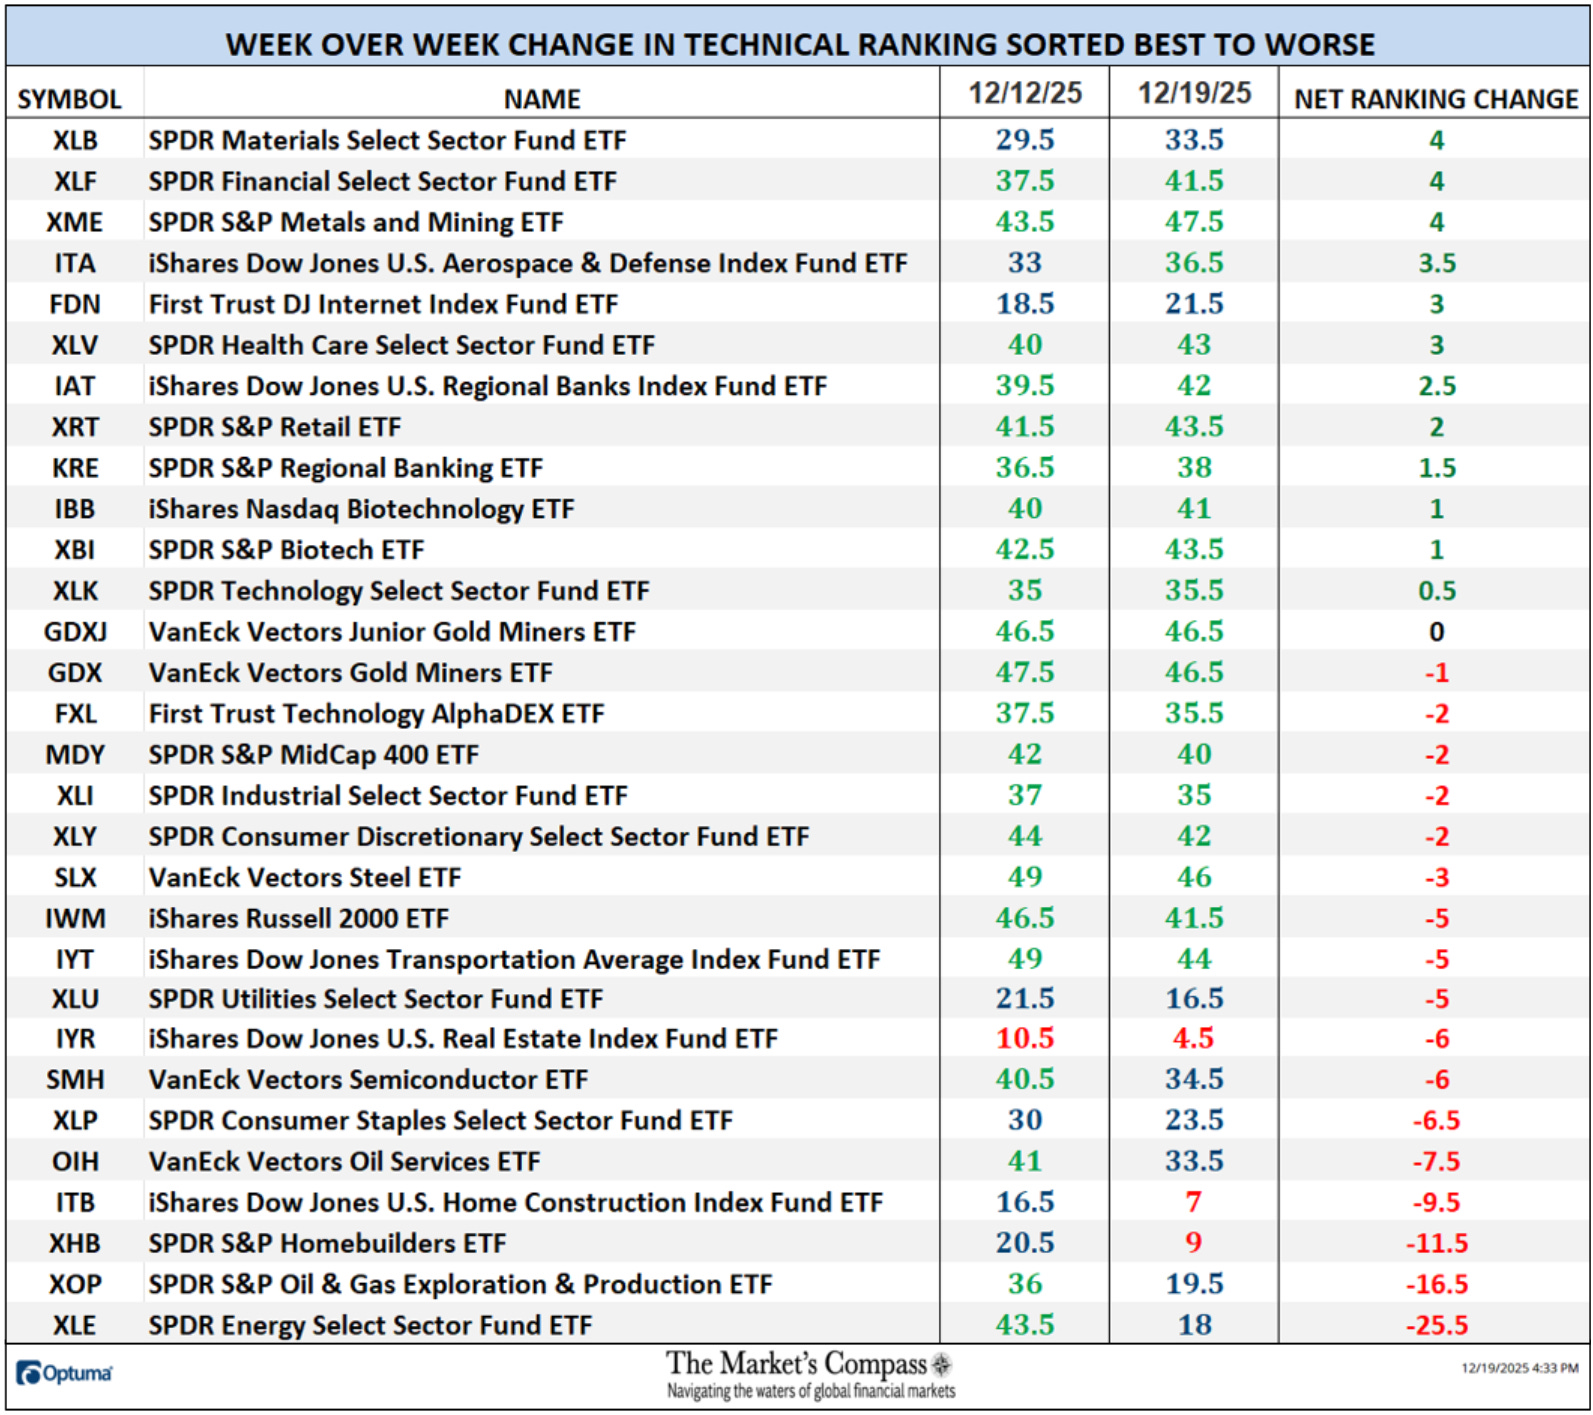
Twelve ETF TRs gained ground last week, one was unchanged, and seventeen had TRs that fell with three dropping double-digits. Nineteen ETF TRs ended the week in the “green zone” (TRs from 35 to 50), eight ended the week in the “blue zone” (TRs from 15.5 to 34.5) and three ended in the “red zone” (TRs between 0 and 15) vs. the previous week when there was twenty two in the “green zone”, seven in the “blue zone”, and only one was in the “red zone”. The average TR loss on the week was -3.07 vs. the week before average TR gain of +1.22. Energy and Homebuilding ETFs drove the Average TR loss lower last week. Excluding the bottom five, the average TR loss would have been -0.81.

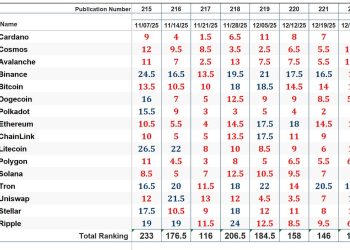
*The Technical Condition Factors are derived from a calculation of the total Individual US Index and Sector ETF Technical Rankings. What is shown in the excel panel below is the total TCFs of all thirty TRs. A few TCFs carry more weight than the others, such as the Weekly Trend Factor and the Weekly Momentum Factor in compiling each individual TR of each of the 30 ETFs. Because of that, the excel sheet below calculates each factor’s weekly reading as a percentage of the possible total.

To fully understand the construction the of The Technical Condition Factors visit the MC’s Technical Indicators page at www.themarketscompass.com and go to “us etfs”.

One technical takeaway would be for example, if the DMC Factor or DMCTF rises to an extreme between 85% and 100%, it would suggest a short-term overbought condition. Conversely, a reading in the range of 0% to 15% would suggest an oversold condition was developing. This past week a reading of 50.95% was registered in the DMCTF or 107 out of a total of 210 positive points, which was down from 67.14% the previous week.

As a confirmation tool, if all eight TCFs improve on a week over week basis, more of the 30 ETFs are improving internally on a technical basis confirming a broader market move higher (think of an advance/decline calculation). Conversely if all eight TCFs fell over the week it confirms a move lower in the broader market. Last week seven TCFs lost ground and one was unchanged

The Total US ETF Technical Ranking (“TER”) Indicator is a total of all 30 ETF rankings and can be looked at as a confirmation/divergence indicator as well as an overbought oversold indicator.

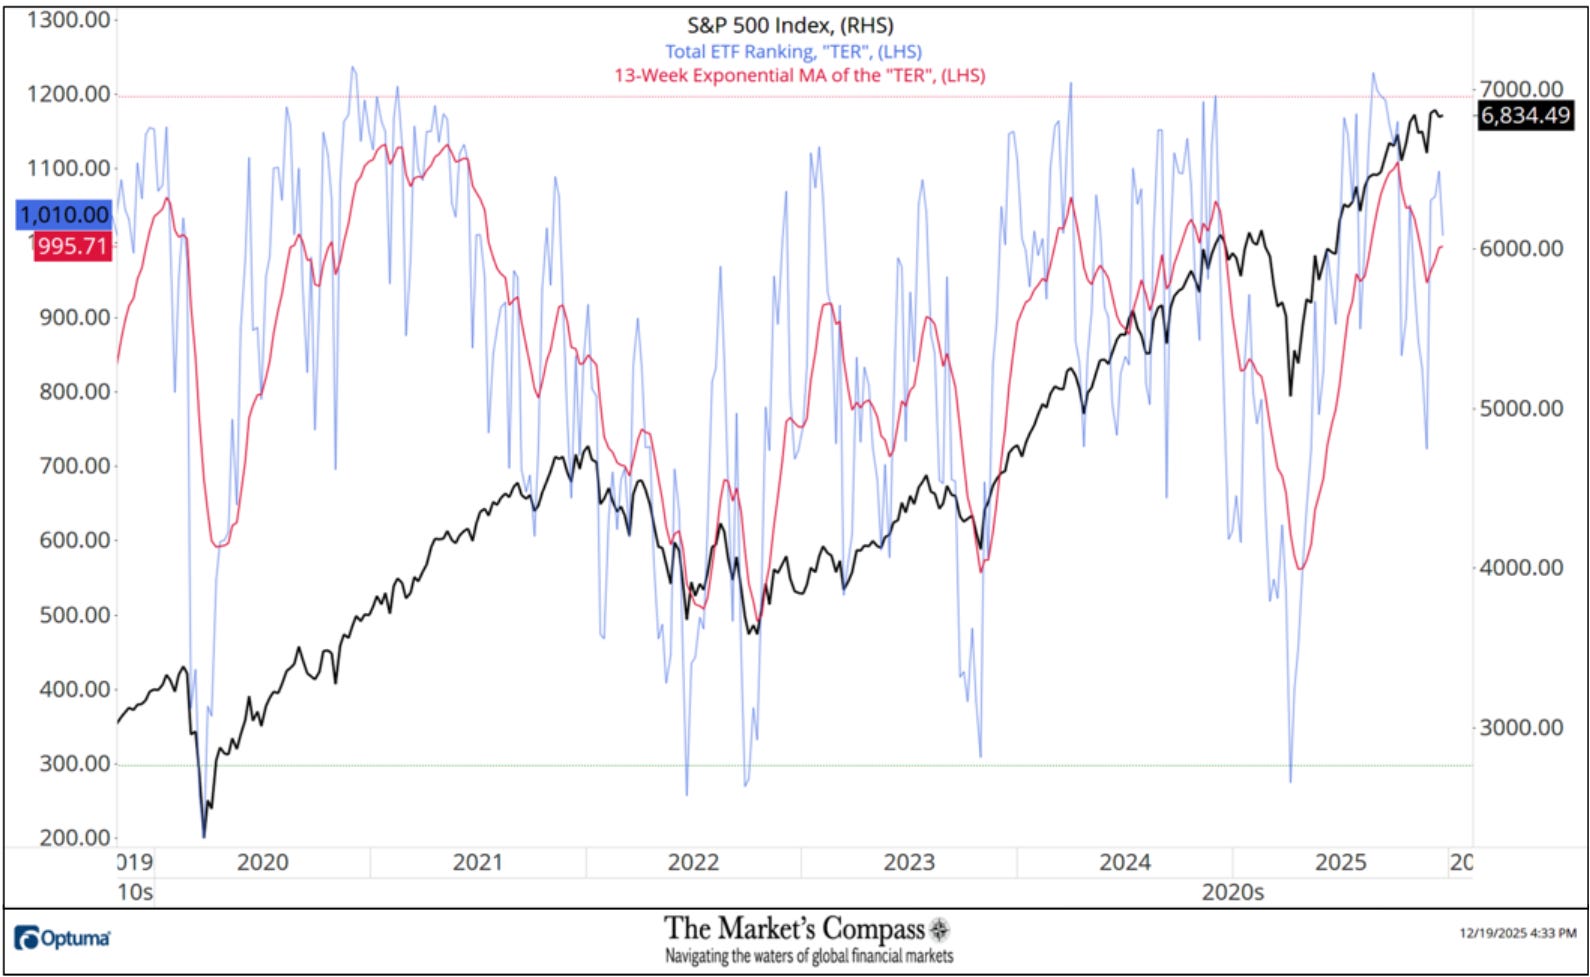
The series of higher weekly closing lows and higher weekly closing highs since April remains intact and three weeks ago the S&P 500 Index registered a record weekly closing high. Yet the Total US ETF Ranking or “TER” failed to confirm the high.

The Weekly Average Technical Ranking (“ATR”) is the average Technical Ranking of the 30 US Index and Sector ETFs we track. Like the TER, it is a confirmation/divergence as well as an overbought/oversold indicator.

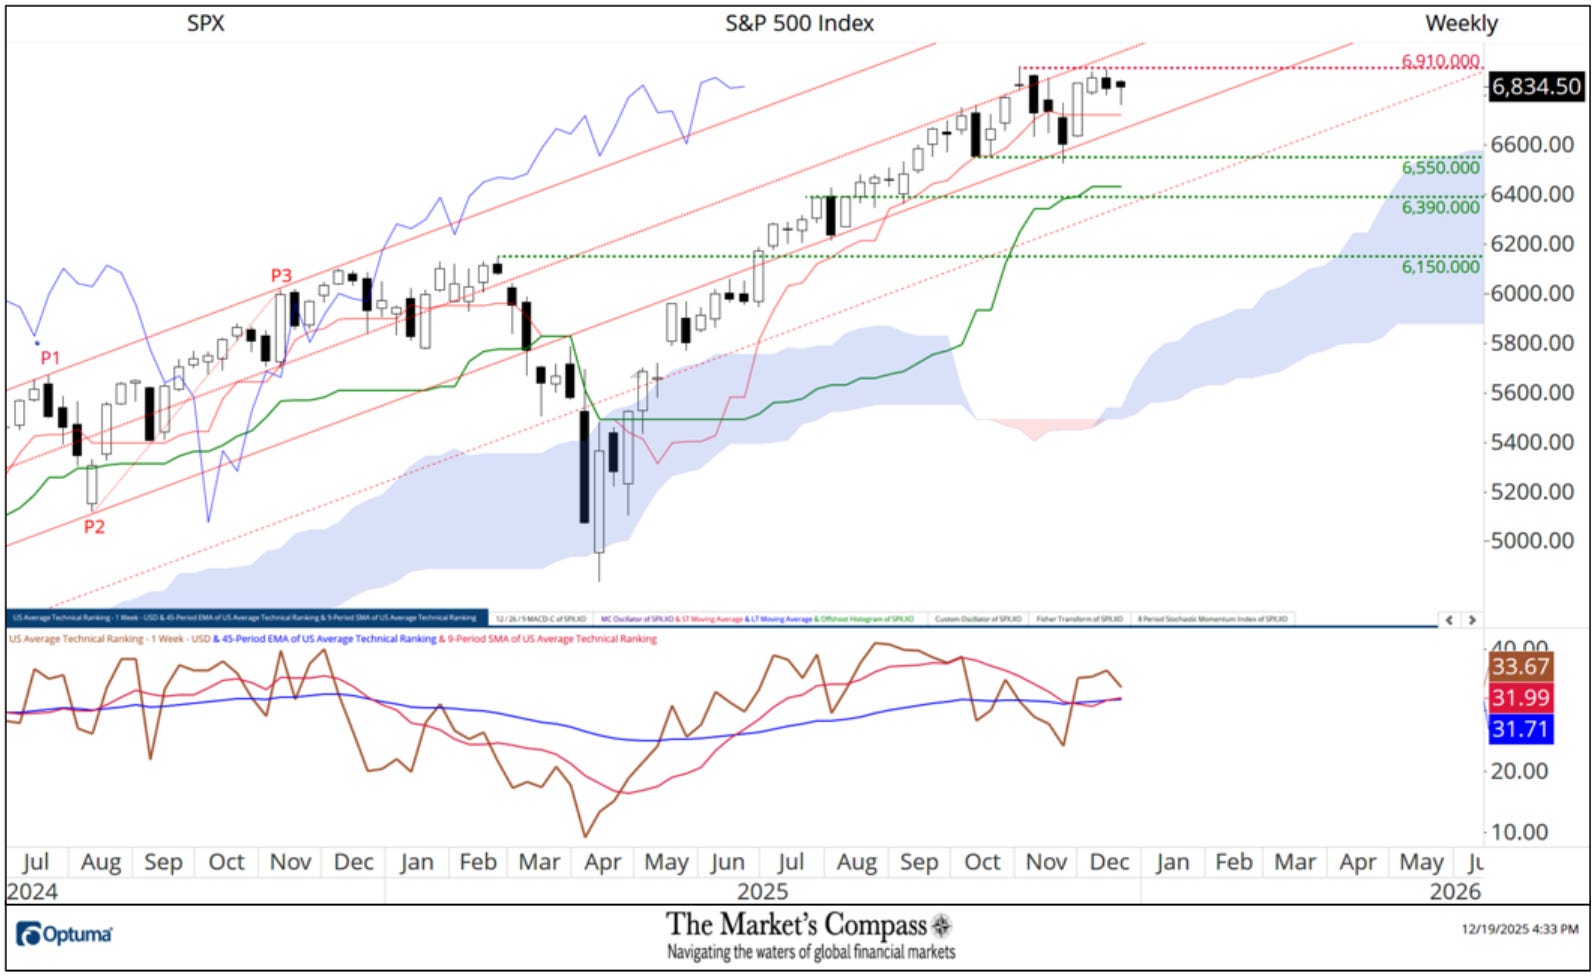
For the past three weeks prices have struggled to overtake the October intra-week highs but have continued to hold above support offered by the Lower Parallel (solid red line) of the Schiff Modified Pitchfork (red P1-P3) on a weekly closing basis since early July giving me the confidence to suggest the Median Line (red dotted line) will be overtaken in the weeks to come. That said, the Average Technical Ranking Oscillator did not confirm the late October highs and the 9-Week Simple Moving Average (red line) is contending with resistance at the longer-term 45-Week Exponential Moving Average (blue line).

*An in-depth comprehensive lesson on Pitchforks is available on my website…

www.themarketscompass.com

Fourteen of the US Index and Sector ETFs that I track in this Study gained ground on an absolute basis last week bettering the +0.10% gain in the SPX Index. Sixteen underperformed the S&P 500 Index on a relative basis. The standout gainers last week were the metals and mining ETF (XME) and gold ETFs (GDX and GDXJ).

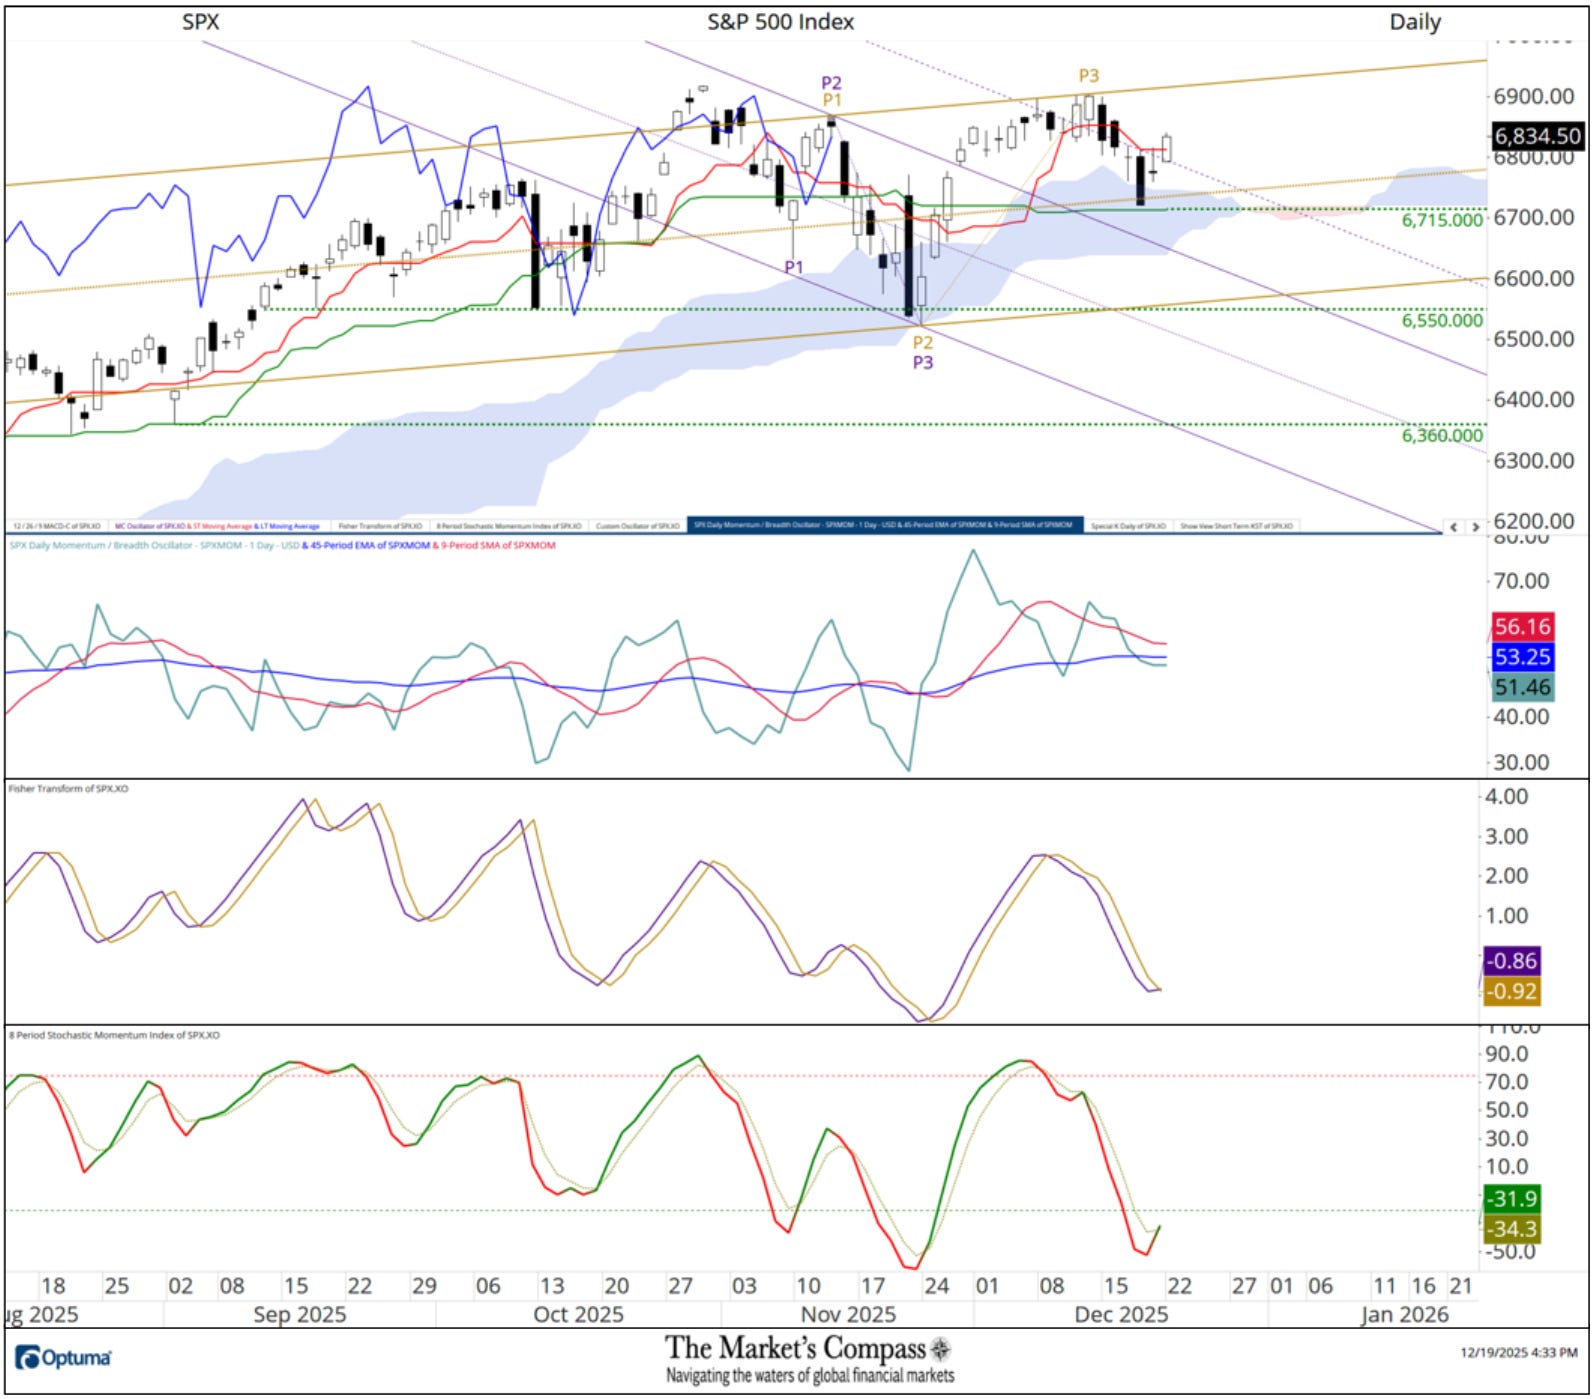
A week ago, last Friday, the SPX Index rolled over, and the selloff deepened last Wednesday with the large cap index falling below Cloud support leading me to draw the new Schiff Modified Pitchfork (gold P1-P3). Wednesday’s drop fell short of a full test of support at the Kijun Plot (green line at 6715.00) and over the next two days recovered from the short-term oversold condition as witnessed by the Stochastic Momentum Index in the bottom chart panel. With it, the Fisher Transform (center momentum panel) is hinting at a turn. The SPX Daily Momentum / Breadth is neutral with the shorter-term Moving Average (red line and longer-term Moving Average (blue line) both tracking sideways. Barring a break of support at the Median Line and the Kijun Plot I believe that a challenge of the Upper Parallel (solid gold line) is in the cards.

The YTD Average Absolute Price precentage fell slightly to +27.55% last week from +27.59% the previous week.

For readers who are unfamiliar with the technical terms or tools referred to in the comments on the technical condition of the SPX can avail themselves of a brief tutorial titled, Tools of Technical Analysis and an in-depth comprehensive lesson on Pitchforks is available on my website…

www.themarketscompass.com

Charts are courtesy of Optuma whose charting software allows the Technical Rankings to be calculated and back tested.

To receive a 30-day trial of Optuma charting software go to…

www.optuma.com/TMC


Source link

ShareTweetShareShare

Related Posts

212,479,300,000 SHIB: Key Shiba Inu Metric Says Demand Is Back

212,479,300,000 SHIB: Key Shiba Inu Metric Says Demand Is Back

by J_News
February 7, 2026
0

After multiple days of flashing consistent bearish signals, the Shiba Inu exchange flow is finally seeing demand return to the...

Bitcoin’s Hidden Driver: The Inverse DXY Relationship

Bitcoin’s Hidden Driver: The Inverse DXY Relationship

by J_News
February 7, 2026
0

IntroductionIn the early years of cryptocurrency, price movements were largely driven by isolated factors: retail adoption, exchange hacks, and technological...

The Market’s Compass Crypto Sweet Sixteen Study

The Market’s Compass Crypto Sweet Sixteen Study

by J_News
February 7, 2026
0

Welcome to this week’s publication of the Market’s Compass Crypto Sweet Sixteen Study #223. The Study tracks the technical condition...

SUP is available for trading!

SUP is available for trading!

by J_News
February 7, 2026
0

We’re thrilled to announce that SUP is available for trading on Kraken! Funding and trading SUP trading is live as...

Dapper Labs Ecosystem: Disney Pinnacle, NFL ALL DAY, and NBA Top Shot Drive Consumer Engagement on Flow

Dapper Labs Ecosystem: Disney Pinnacle, NFL ALL DAY, and NBA Top Shot Drive Consumer Engagement on Flow

by J_News
February 7, 2026
0

Dapper Labs, the leader in digital sports and entertainment collectibles, today announced a sweep of major milestones and activations across...

Load More

Enter your email address:

Delivered by FeedBurner

Quick Navigate

  • Home
  • Crypto
  • Crypto Technical Analysis
  • Top News
  • Thank You
  • Store
  • Crypto Vouchers
  • About Us
  • What Cryptocurrency Is and ANKR Price Prediction
  • Cosmos cryptocurrency price prediction

Top News

Toncoin Gains 2% as Short-Term Uptrend Pattern Emerges

Bitcoin Dominance Logs Rapid Plunge as XRP, SHIB, and Other Altcoins Surge

Michael Saylor’s Strategy caps 2025 with 1,229 Bitcoin purchase

© 2021 mtrushmorecrypto - Crypto Related News Blog

We use cookies on our website to give you the most relevant experience by remembering your preferences and repeat visits. By clicking “Accept”, you consent to the use of ALL the cookies.
Do not sell my personal information.
Cookie SettingsAccept
Manage consent

Privacy Overview

This website uses cookies to improve your experience while you navigate through the website. Out of these, the cookies that are categorized as necessary are stored on your browser as they are essential for the working of basic functionalities of the website. We also use third-party cookies that help us analyze and understand how you use this website. These cookies will be stored in your browser only with your consent. You also have the option to opt-out of these cookies. But opting out of some of these cookies may affect your browsing experience.
Necessary
Always Enabled
Necessary cookies are absolutely essential for the website to function properly. These cookies ensure basic functionalities and security features of the website, anonymously.
CookieDurationDescription
cookielawinfo-checkbox-analytics11 monthsThis cookie is set by GDPR Cookie Consent plugin. The cookie is used to store the user consent for the cookies in the category "Analytics".
cookielawinfo-checkbox-functional11 monthsThe cookie is set by GDPR cookie consent to record the user consent for the cookies in the category "Functional".
cookielawinfo-checkbox-necessary11 monthsThis cookie is set by GDPR Cookie Consent plugin. The cookies is used to store the user consent for the cookies in the category "Necessary".
cookielawinfo-checkbox-others11 monthsThis cookie is set by GDPR Cookie Consent plugin. The cookie is used to store the user consent for the cookies in the category "Other.
cookielawinfo-checkbox-performance11 monthsThis cookie is set by GDPR Cookie Consent plugin. The cookie is used to store the user consent for the cookies in the category "Performance".
viewed_cookie_policy11 monthsThe cookie is set by the GDPR Cookie Consent plugin and is used to store whether or not user has consented to the use of cookies. It does not store any personal data.
Functional
Functional cookies help to perform certain functionalities like sharing the content of the website on social media platforms, collect feedbacks, and other third-party features.
Performance
Performance cookies are used to understand and analyze the key performance indexes of the website which helps in delivering a better user experience for the visitors.
Analytics
Analytical cookies are used to understand how visitors interact with the website. These cookies help provide information on metrics the number of visitors, bounce rate, traffic source, etc.
Advertisement
Advertisement cookies are used to provide visitors with relevant ads and marketing campaigns. These cookies track visitors across websites and collect information to provide customized ads.
Others
Other uncategorized cookies are those that are being analyzed and have not been classified into a category as yet.
SAVE & ACCEPT
No Result
View All Result
  • Home
  • Top News
  • Crypto
  • Crypto Technical Analysis
  • About Us
  • Crypto Vouchers
  • Cryptocurrency and ANKR Price Prediction
  • Cosmos cryptocurrency price prediction

© 2021 mtrushmorecrypto - Crypto Related News Blog