


Welcome to The Market’s Compass Emerging Market’s Country ETF Study, Week #591. As always, it highlights the technical changes of the 20 EM Country ETFs that I track on a weekly basis and publish every third week. Paid subscribers will receive this week’s unabridged Emerging Market’s Country ETF Study sent to their registered e-mail. Past publications can be accessed by paid subscribers via The Market’s Compass Substack Blog. Next week I will be publishing The Market’s Compass Developed Markets Country ETF Study. On Sunday I published the latest edition of The Market’s Compass Crypto Sweet Sixteen Study which I publish on a weekly basis and tracks the technical changes of sixteen of the larger capitalized Cryptocurrencies.


To understand the methodology used in constructing the objective EM Country ETF Individual Technical Rankings visit the mc’s technical indicators page at www.themarketscompass.com and select “em country etfs”. What follows is a Cliff Notes version* of the full explanation of the methodology I use…
*The technical ranking system is a quantitative approach that utilizes multiple technical considerations that include but are not limited to trend, momentum, measurements of accumulation/distribution and relative strength of each individual 20 EM Country ETFs that can range between 0 and 50. The Total EM Technical Ranking or “TEMTR” is the sum of the twenty individual TRs and can be viewed as an overbought / oversold indicator as well as a confirmation / non-confirmation indicator. There is also a Total Ranking for each geographic region that can be viewed as a relative measurement on a week over week basis.
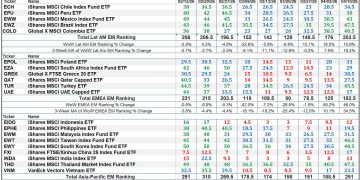
This past week The Total EM Technical Ranking or “TEMTR” rose 30.13% to 637 adding to the previous week’s 29.50% gain to 489.5 from 378 three weeks ago. The Total EMEA Ranking rose the most of the three geographic regions last week, +46.0% to 182.5 from 125 two weeks ago when it rose 59.2% from the week ending 3/27 when it reached its nadir at 78.5. Last week the Total Asia-Pacific Ranking rose 33.2% to 251 from 188.5 the week before. The Total Lat AM Ranking rose 15.6% to 203.5 from 176 the previous week.
All twenty EM Country ETFs I track in these pages registered gains in their Technical Rankings or TRs over the past week reflecting the broad-based improvement in the technical condition of the EM ETFs. Last week nine of the TRs were in the “green zone” (TRs between 34.5 and 50), nine were in the “blue zone” (TRs between 15.5 and 34), and two were in the “red zone” (TRs between 0 and 15). The previous week only four TRs were in the “green zone”, nine were in the “blue zone”, and seven were in the “red zone”. Not currently or since February 28, 2025, has there been a Lat AM ETF Technical Ranking in the “red zone”.
*To understand the construction the of The Technical Condition Factors visit the Market’s Compass website www.themarketscompass.com and go to the mc’s technical indicators page and select “em country etfs”.
A short version of the how the Technical Condition Factors are calculated follows…
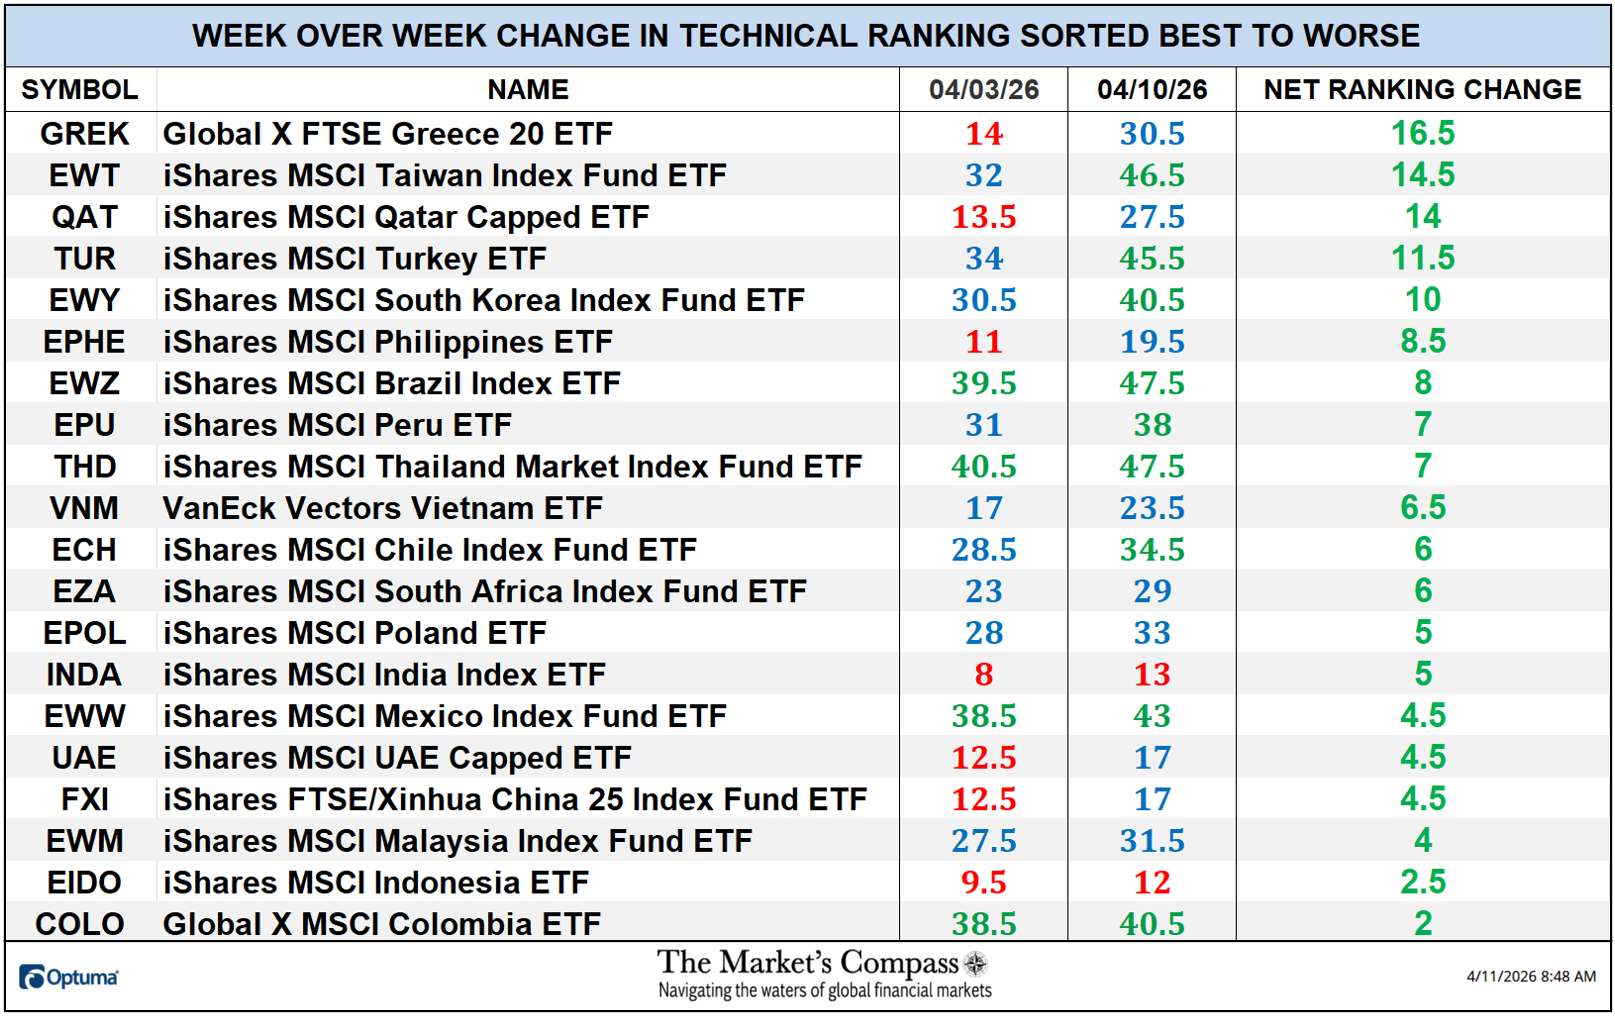
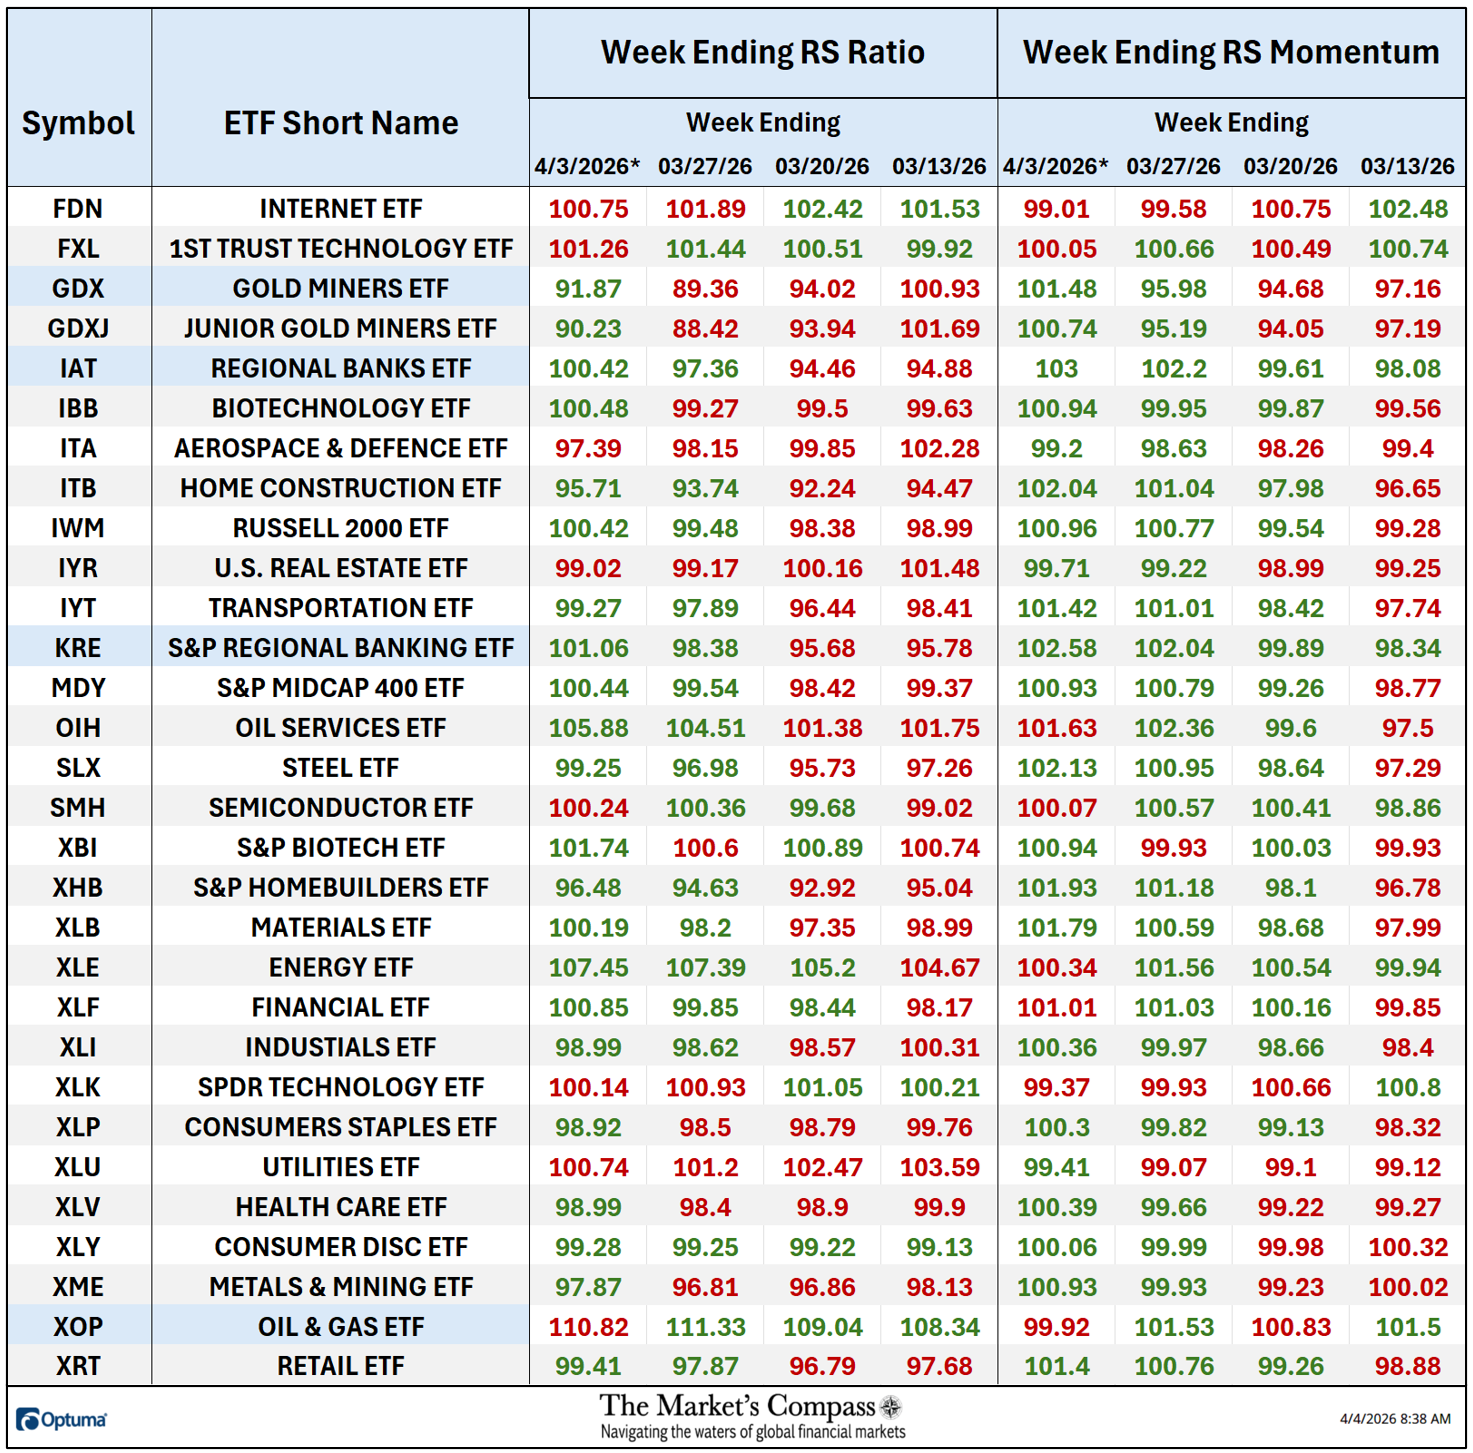
There are eight Technical Condition Factors (“TCFs”) that are a summation of the twenty ETFs TRs technical condition of each TCF question. The eight Technical Condition Factors do not ask the same number of questions. That is why it is calculated as a percentage. If a TCF individual reading is 100% that would mean that all Twenty ETFs fullfilled that particular TCF criterior.
This past week a reading an overbought 96.43% was registered in the Daily Momentum Technical Condition Factor (”DMTCF”) or 135 out of a possible total of 140 positive points.
As a confirmation tool, if all eight TCFs improve on a week-over-week basis, more of the 20 ETFs are improving internally on a technical basis, confirming a broader market move higher (think of an advance/decline calculation). Conversely if all eight TCFs fall on a week-over-week basis it confirms a broader market move lower.
Last week, seven TCFs rose, and one was unchanged confirming the broader EM market move higher but the “DMTCF” suggest a stretched technical condition.
The Relative Rotation Graph, commonly referred to as RRGs were developed in 2004-2005 by Julius de Kempenaer. These charts are a unique visualization tool for relative strength analysis. Chartists can use RRGs to analyze the relative strength trends of several securities against a common benchmark, (in this case the EEM) and against each other over any given time period (in the case below, daily) over the past three weeks. The power of RRG is its ability to plot relative performance on one graph and show true rotation. All RRGs charts use four quadrants to define the four phases of a relative trend. The Optuma RRG charts uses, From Leading (in green) to Weakening (in yellow) to Lagging (in pink) to Improving (in blue) and back to Leading (in green). True rotations can be seen as securities move from one quadrant to the other over time. This is only a brief explanation of how to interpret RRG charts. To learn more, see the post scripts and links at the end of this Blog.
Not all 20 ETFs are plotted in this RRG Chart. I have done this for clarity purposes. Those which I believe are of higher technical interest remain.
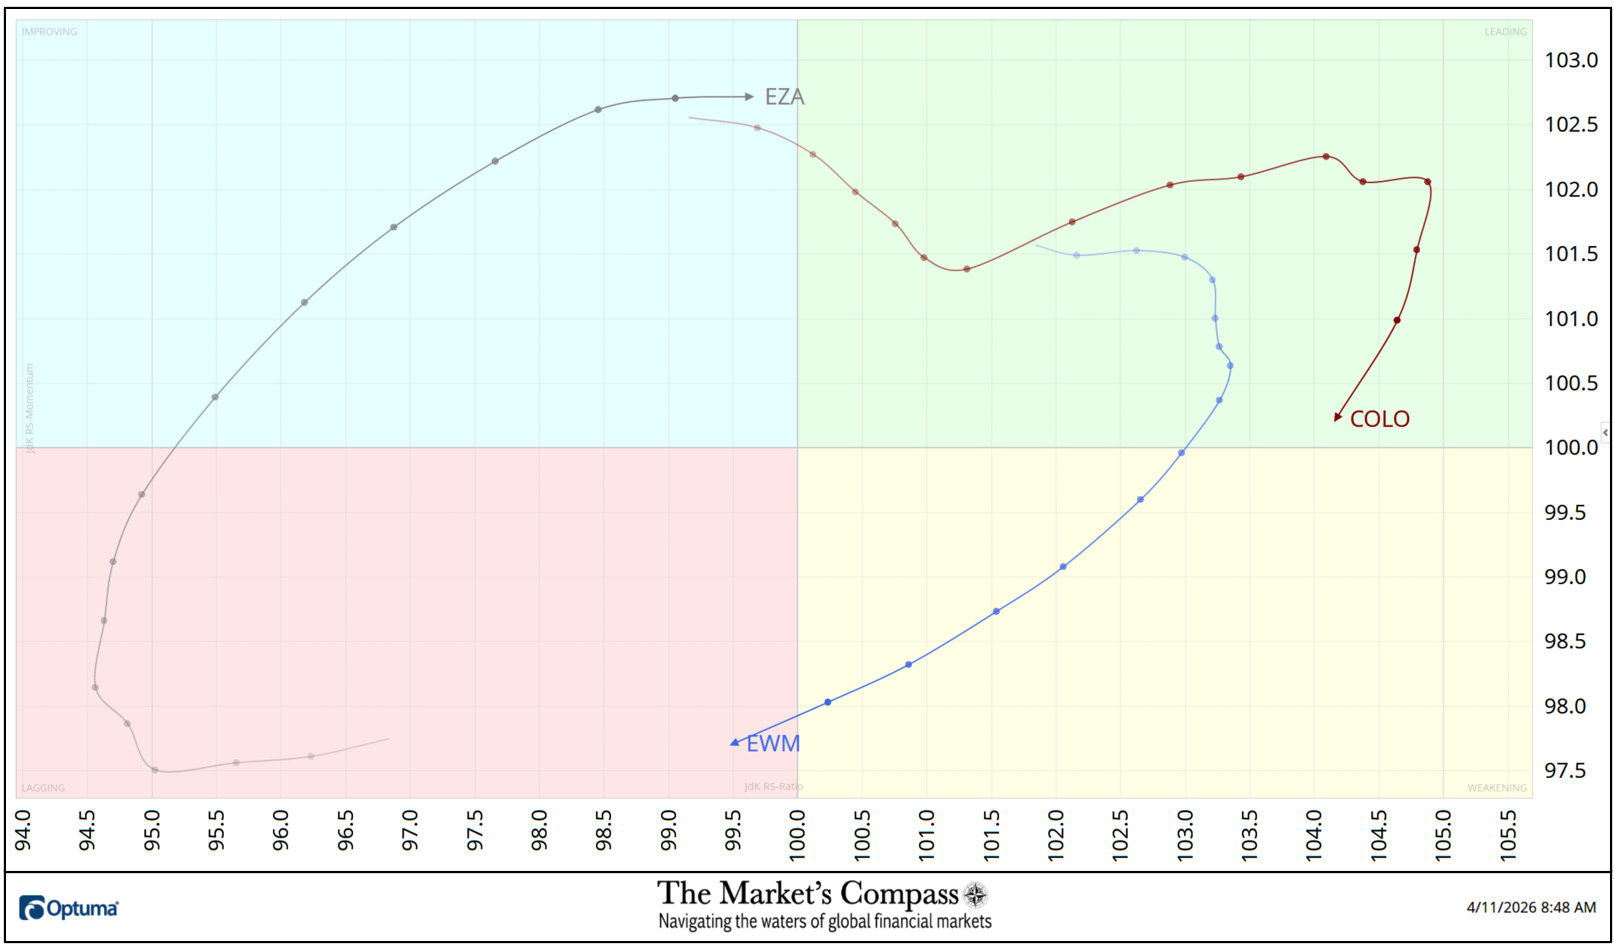
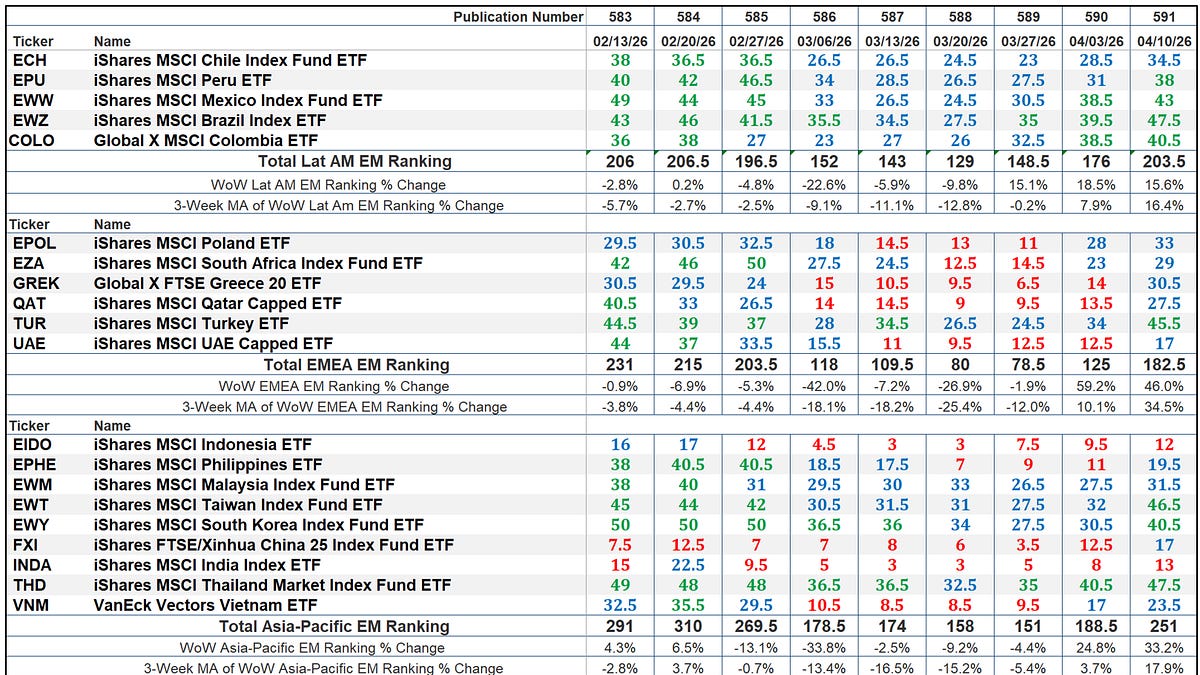
Despite the loss of Relative Strength Momentum last week, the Global X MSCI Columbia ETF (COLO) still retains its “best of the 20” pole position on a Relative Strength basis at 104.16 (see the Tabulation Table below). Over the past three weeks the iShares MSCI Malaysia Index Fund ETF (EWM) has clocked a three Quadrant move by falling out of the Leading Quadrant, through the Weakening Quadrant and ending last week entering the Lagging Quadrant exhibiting falling Relative Strength Momentum (see the Tabulation Table below). In a noteworthy recovery, the iShares MSCI Brazil Index Fund ETF (EWZ) has displayed an impressive rebound by rising out of the Lagging Quadrant and into the Improving Quadrant and is only one good day away from entering the Leading Quadrant.
The “Tabulation Table” below marks the Relative Strength and Relative Strength Momentum readings vs. the iShares MSCI Emerging Markets Index ETF or EEM. It begins with the readings at the end of last week followed by the trailing three weeks that includes the readings from the last Study for the week ending 1/16. If there has been an improvement in either the Relative Strength Ratio or the Relative Strength Momentum reading on a week-over-week basis I have highlighted it in green. If there has been a contraction in either, it is highlighted in red and an unchanged reading in either will remain black. The color-coding system serves as a heat map over the past four Friday’s readings highlighting either the continued improvement, deterioration, or stasis vs. the benchmark, the EEM. The ETFs that are displayed on the RRG chart above are highlighted in blue.
*The “TEMTR” is the sum of the 20 Individual Objective EM ETF Technical Rankings. It serves as an overbought or oversold as well as a confirmation / non-confirmation indicator.
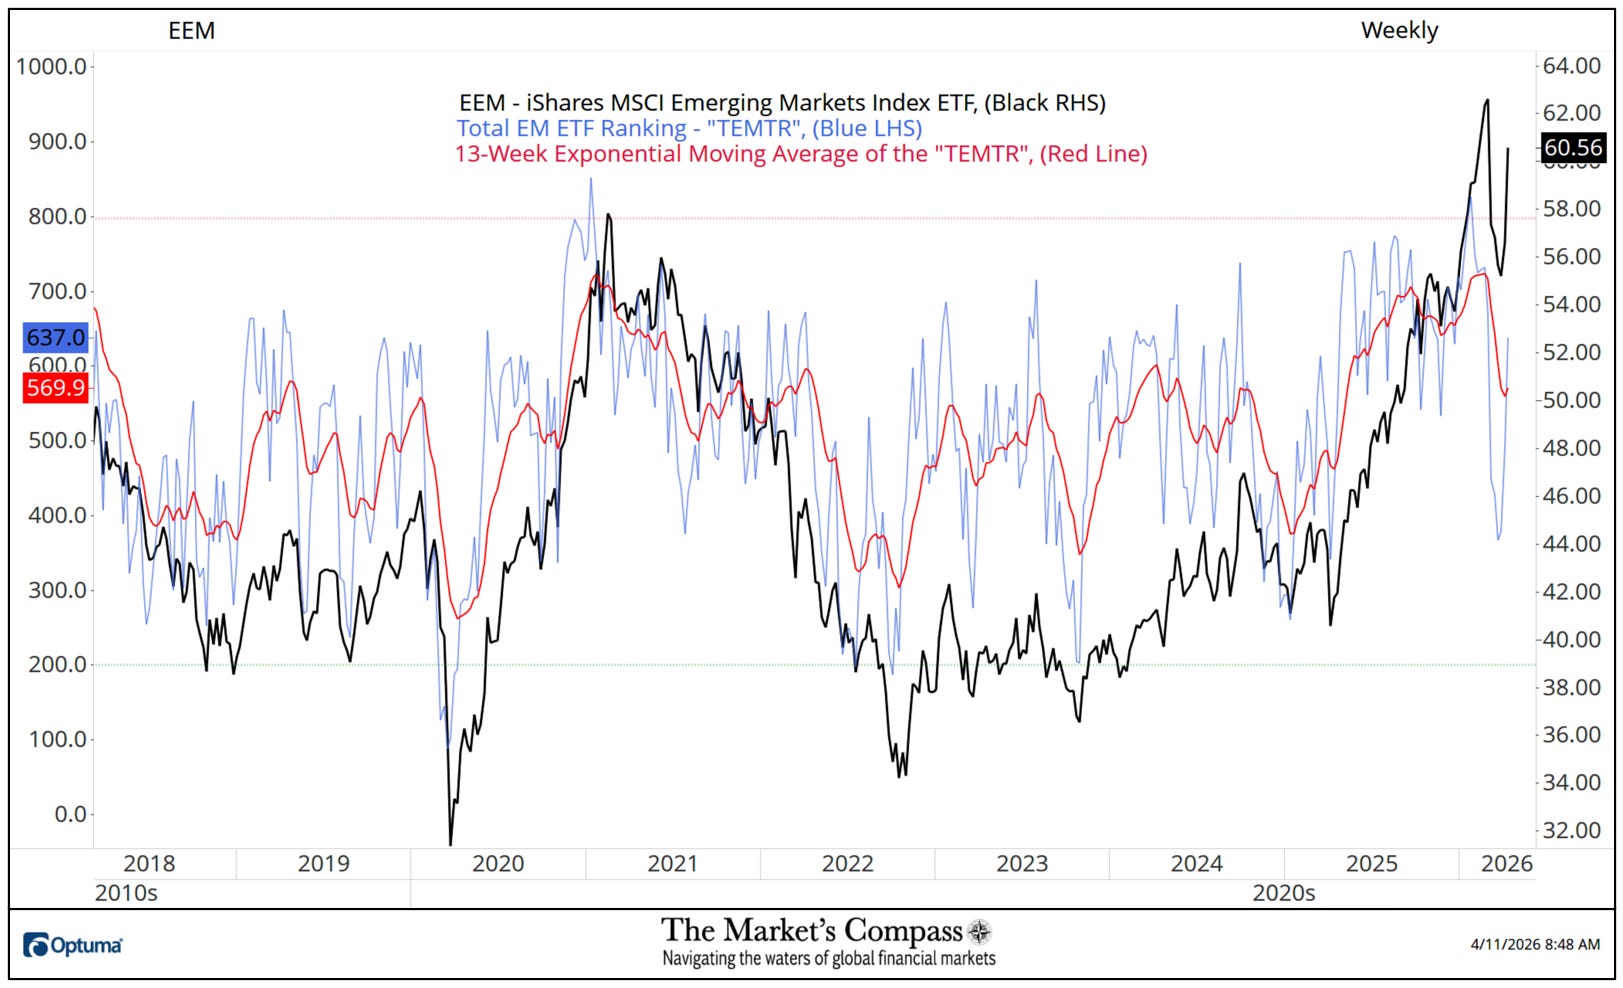
Last Wednesday’s sharp rally was likely fueled in part by short covering and a dramatic reversal in the USD, but it would be folly to argue with the impulsive nature of the decisive price move. The “TEMTR” rose in concert with price as it blasted back above the 13-Week Exponential Moving Average. Needless to say, the prospect of peace in the Middle East is tenuous at best and I would expect that the price gap (shown in the Daily chart that follows) will likely be filled as the iShares MSCI Emerging Markets ETF (EEM) retraces the rally.
*The “ATR” like the “TEMTR” serves as an overbought or oversold as well as a confirmation / non-confirmation indicator.
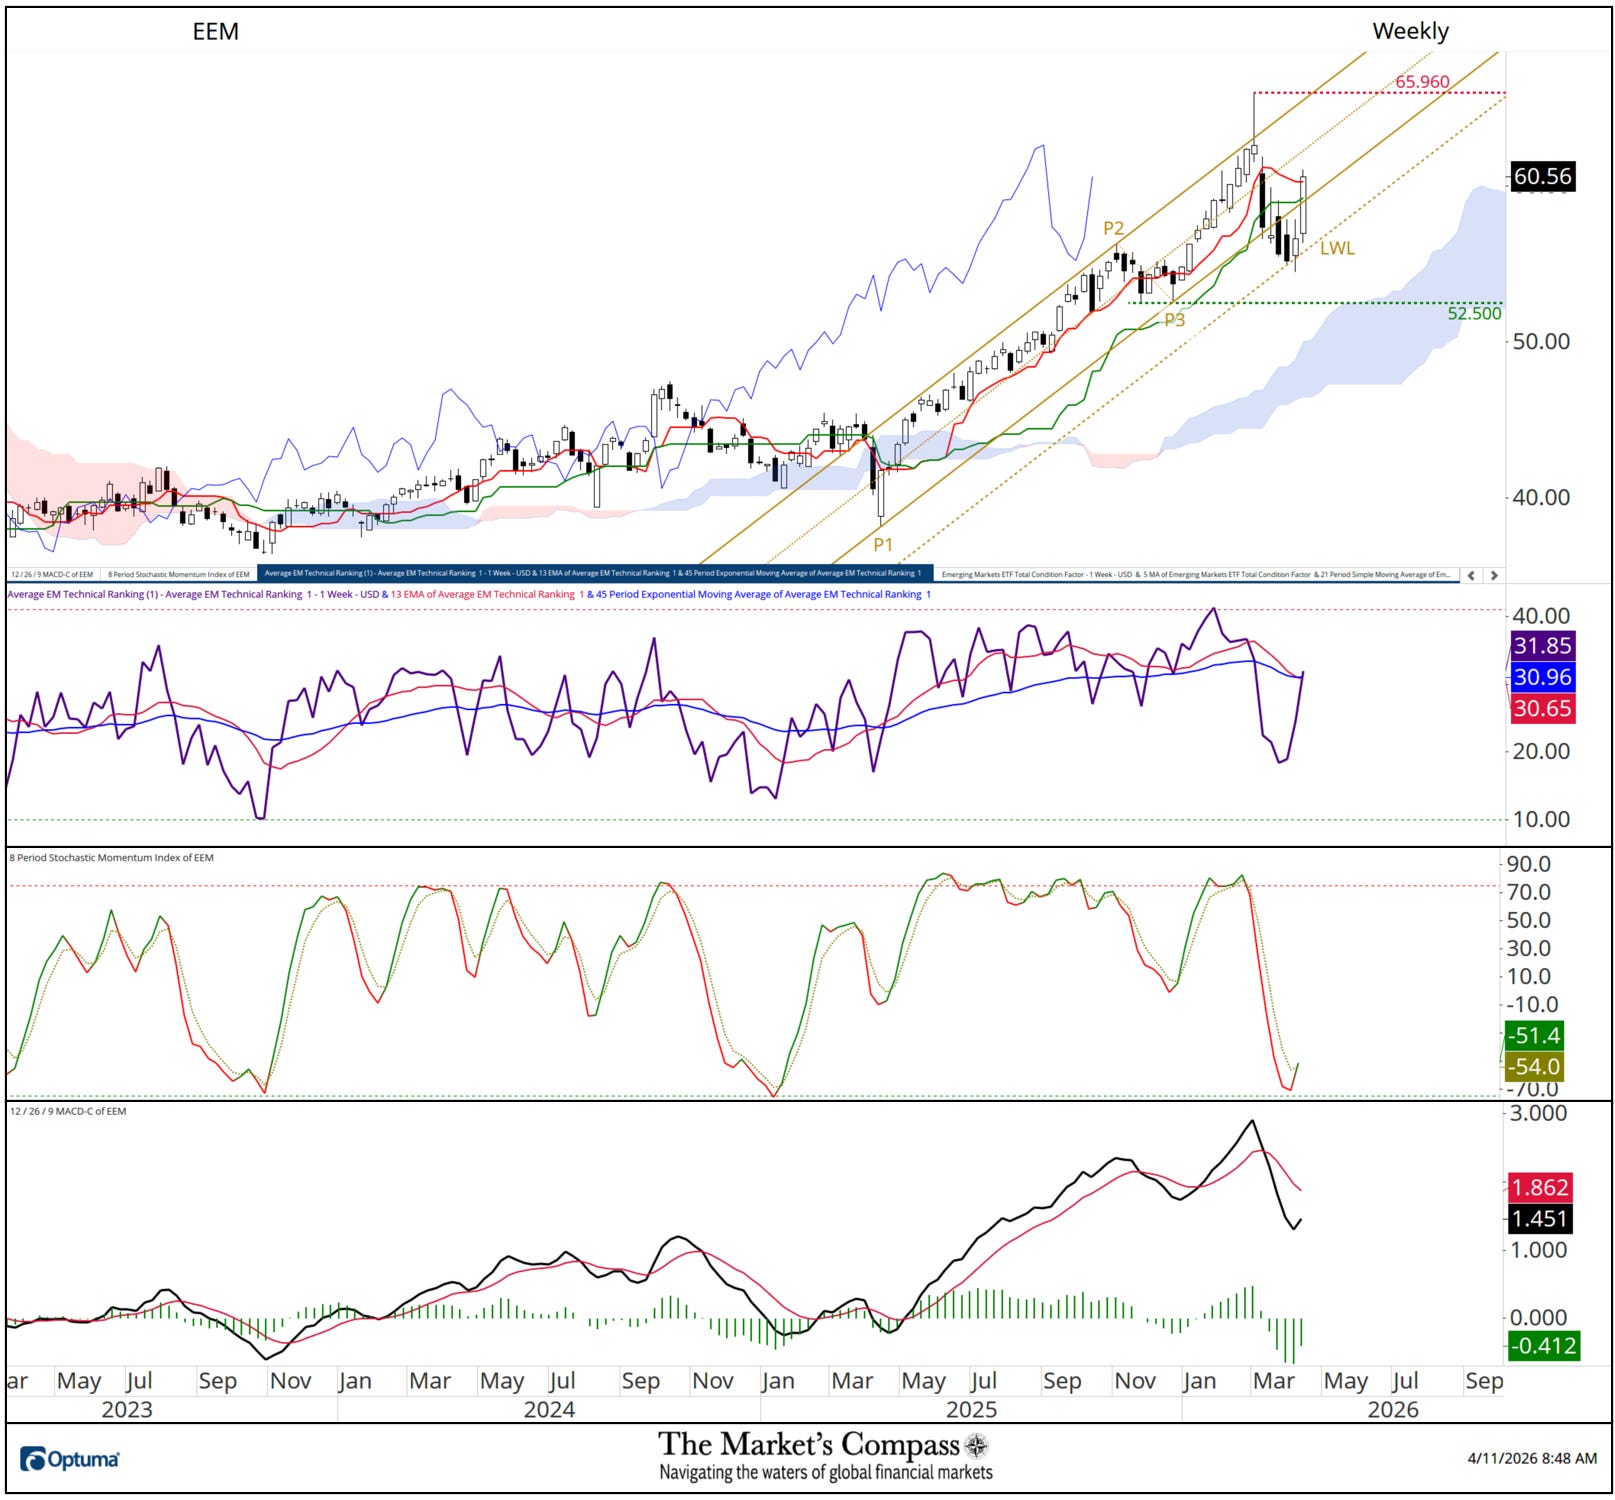
The Lower Warning Line (gold LWL) of the Schiff Modified Pitchfork (gold P1-P3) became support to further selling in the EEM and last week the ETF retook the ground above the broken Lower Parallel (solid gold line) and both the Kijun (green line) and Tekan (red line) Plots. The Average Technical Ranking (violet line under the price panel) turned abruptly higher with the +7.0% rally last week and has edged its way through both moving averages. The shorter-term 8-Week Stochastic Momentum Index (center panel) had become oversold and has turned back through its signal line. I am now marking key support at the P3 pivot low at 52.50.
Learn about Pitchforks and their application in the three-part Pitchfork tutorial at the Market’s Compass website, www.themarketscompass.com
More on the technical condition of the EEM in Thoughts on the Short-Term Technical Condition of the EEM but first…
*Does not include dividends if any.
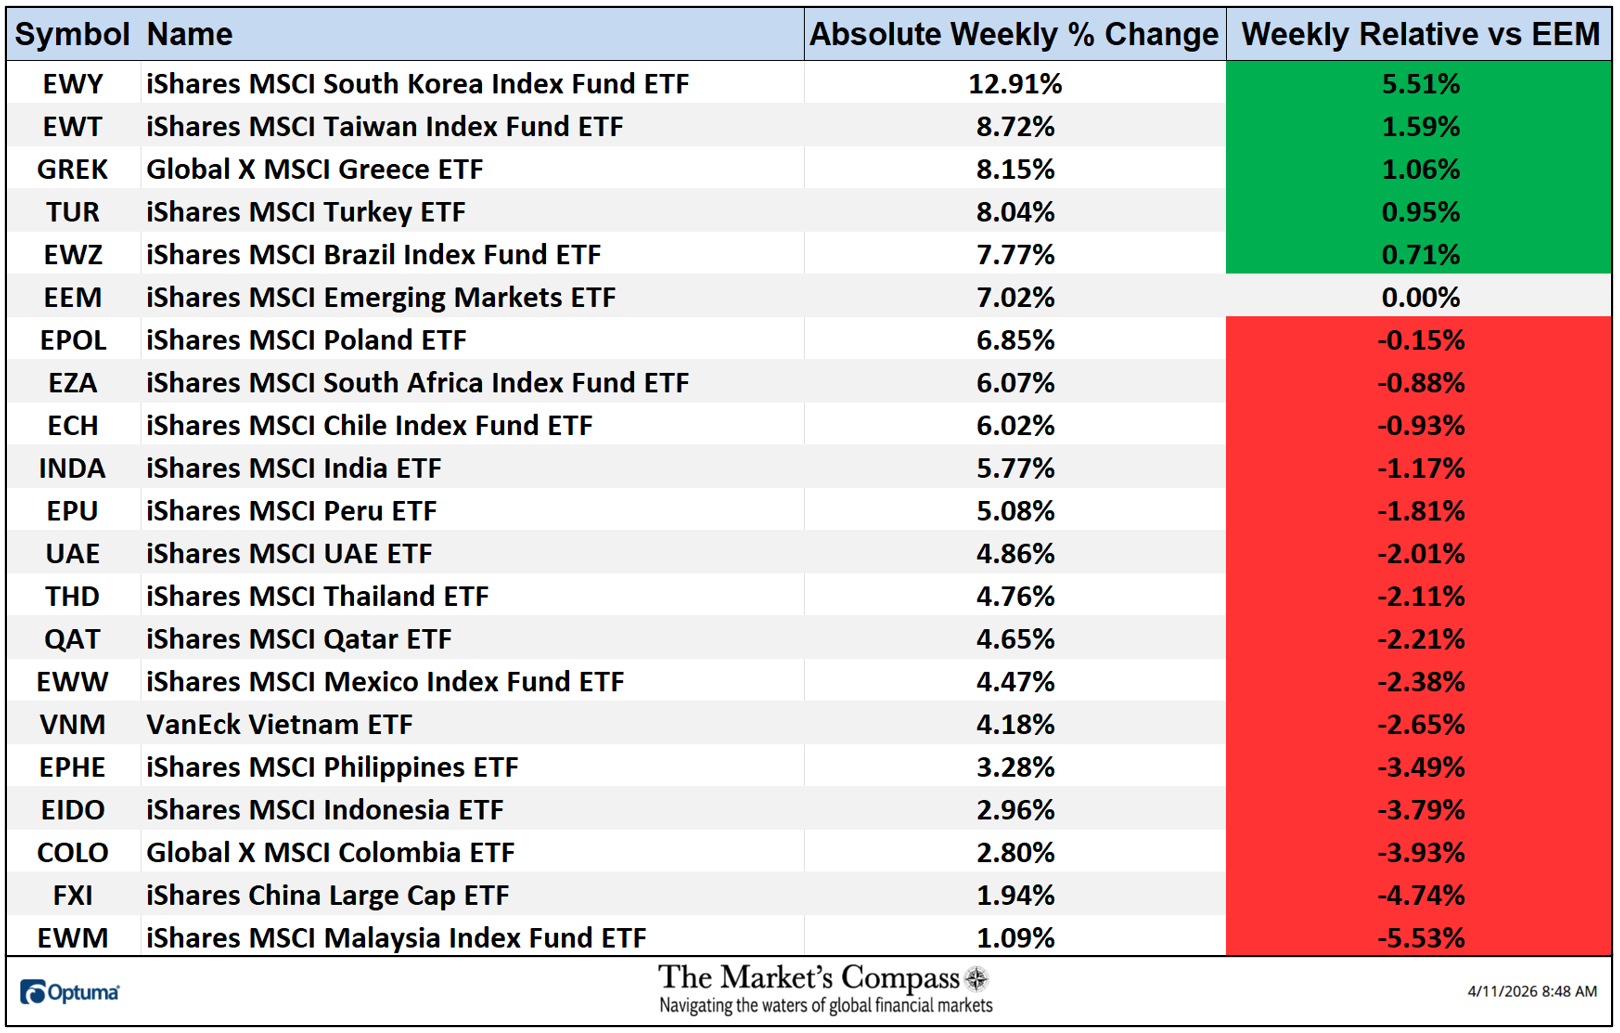
All twenty EM Country ETFs were up on an absolute basis last week. Five of the EM ETFs outperformed the +7.2% gain in the EEM on a relative basis and fifteen underperformed. The average five-day absolute gain in the Emerging Markets ETFs was +5.52%, adding to the +3.41% gain the previous week.
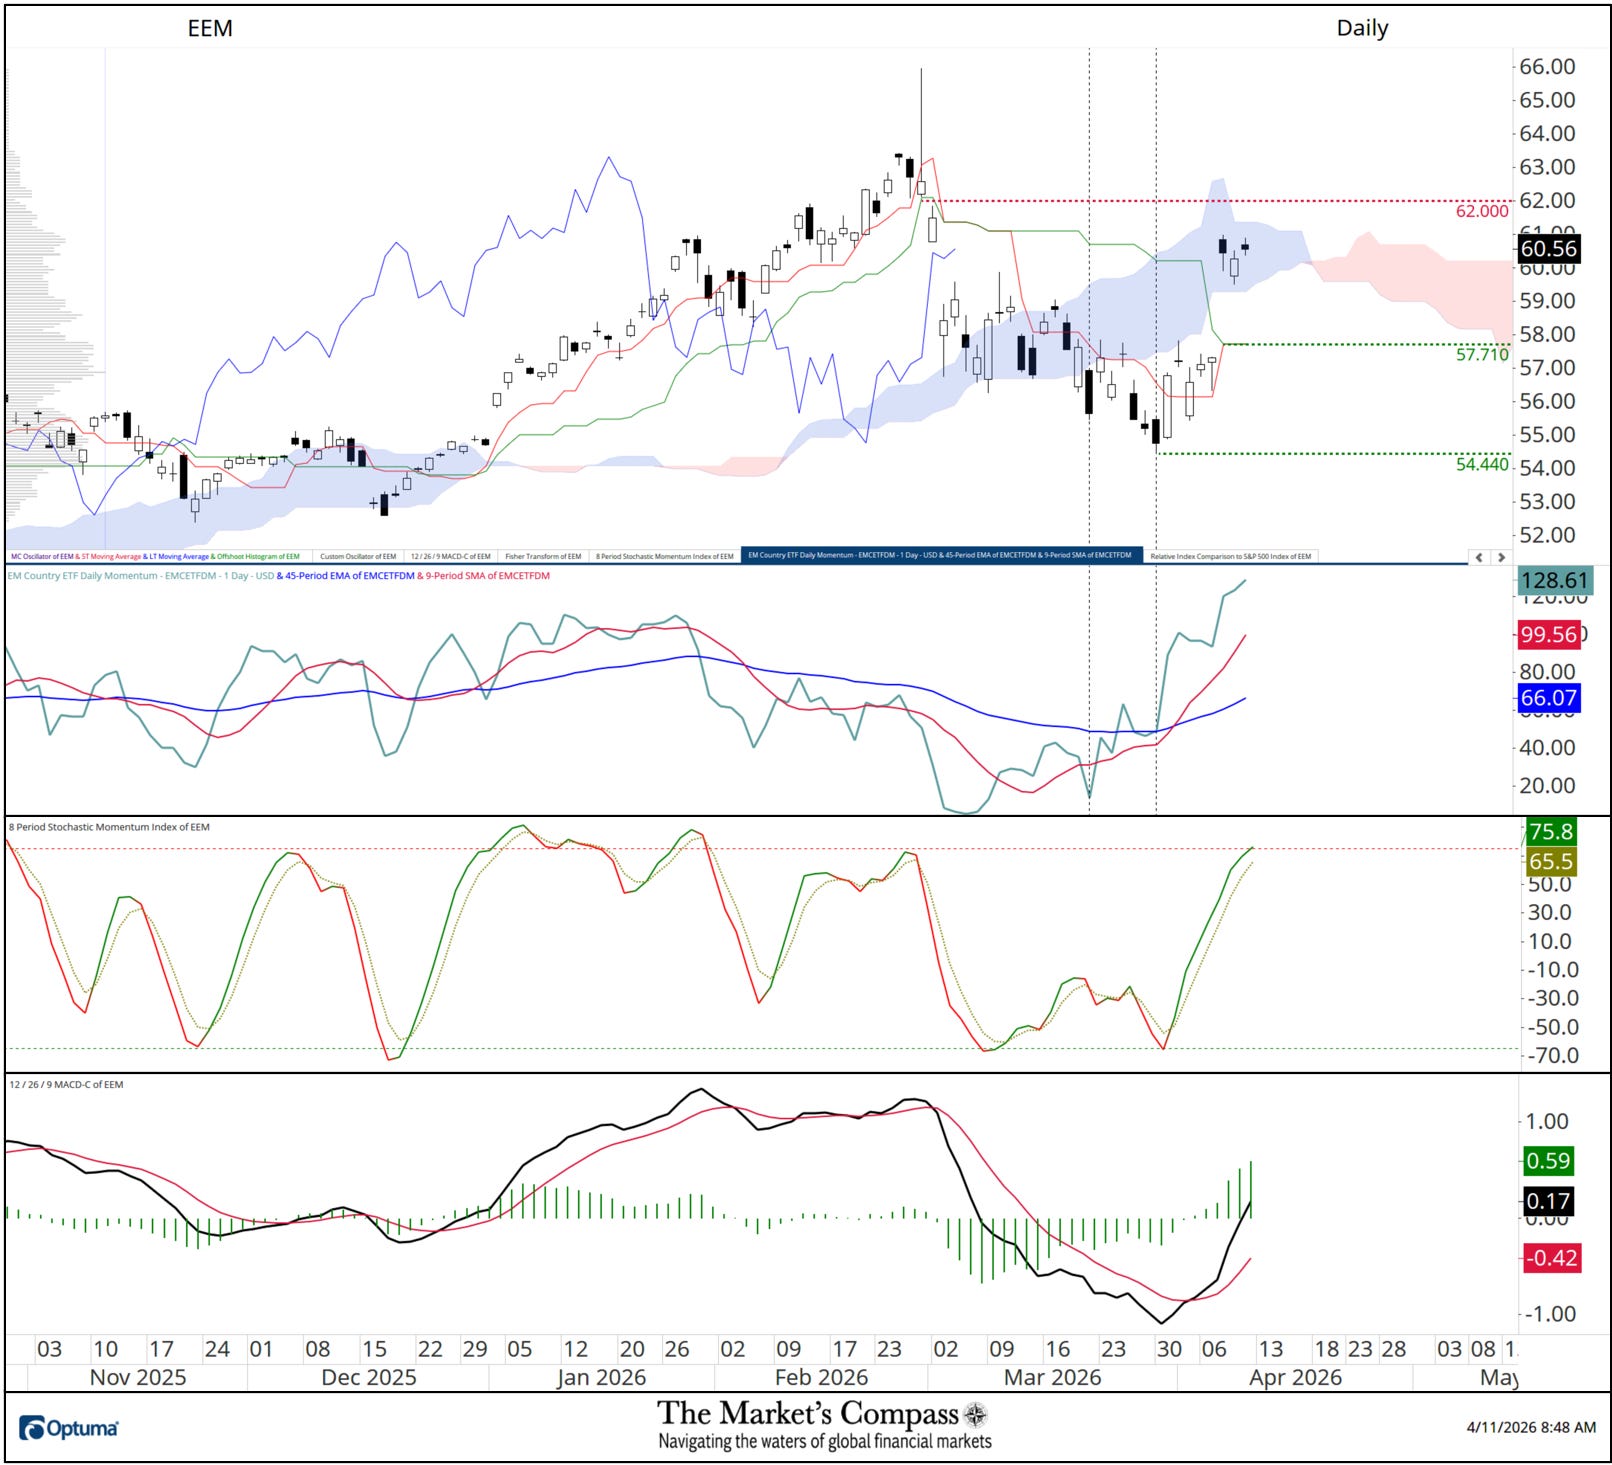
The EEM rallied back into the Cloud last Wednesday and as of last Friday the EM ETF remained in the confines of the Cloud. The 8-Day Momentum Stochastic Index (center panel) bounced from oversold territory to an overbought reading at the end of the week. MACD turned higher as well, overtaking its signal line and is back in positive territory. The EM Country ETF Daily Momentum / Breadth Oscillator turned at a higher low when prices fell to new lows (vertical dashed line) giving a solid indication that downside price momentum had reached an extreme in concert with breadth improving, but the Oscillator has become stretched as well. Prices will likely test Cloud support and price and the Kijun Plot support at the 57.71 level sooner than later.
All the charts are courtesy of Optuma whose charting software enables anyone to visualize any data including my Objective Technical Rankings. The following links are an introduction and an in-depth tutorial on RRG Charts…
https://www.optuma.com/videos/introduction-to-rrg/
https://www.optuma.com/videos/optuma-webinar-2-rrgs/
To receive a 30-day trial of Optuma charting software go to…