Welcome to this week’s publication of the Market’s Compass Crypto Sweet Sixteen Study #221. The Study tracks the technical condition of sixteen of the larger market cap cryptocurrencies. Every week the Studies will highlight the technical changes of the 16 cryptocurrencies that I track as well as highlights on noteworthy moves in individual Cryptocurrencies and Indexes. As always, paid subscribers will receive this week’s unabridged Market’s Compass Crypto Sweet Sixteen Study sent to their registered email Sundays*. Past publications including the Weekly ETF Studies can be accessed by paid subscribers via The Market’s Compass Substack Blog.

*In celebration of the Hanukkah and Christmas Holidays it is also being sent to free subscribers.
An explanation of my objective Individual Technical Rankings and Sweet Sixteen Total Technical Ranking go to www.themarketscompass.com. Then go to the MC’s Technical Indicators and select “crypto sweet 16”. What follows is a Cliff Notes version* of the full explanation…
*The technical ranking system is a quantitative approach that utilizes multiple technical considerations that include but are not limited to trend, momentum, measurements of accumulation/distribution and relative strength. The TR of each individual Cryptocurrency can range from 0 to 50.
The Excel spreadsheet below indicates the the objective Technical Ranking (“TR”) of each individual Cryptocurrency and the Sweet Sixteen Total Technical Ranking (“SSTTR”) as of last Friday*. The second Excel spreadsheet indicates the week over week change in the “TR” of each individual Cryptocurrency.
The Sweet Sixteen Total Technical Ranking fell last week (for the fourth week in a row), down -7.59% to 146 from 158 the previous week but nonetheless that reading is still above the deeply oversold reading of 116 reading five weeks ago that marked an all-time low since I began calculating the “SSTTR” in September of 2022.
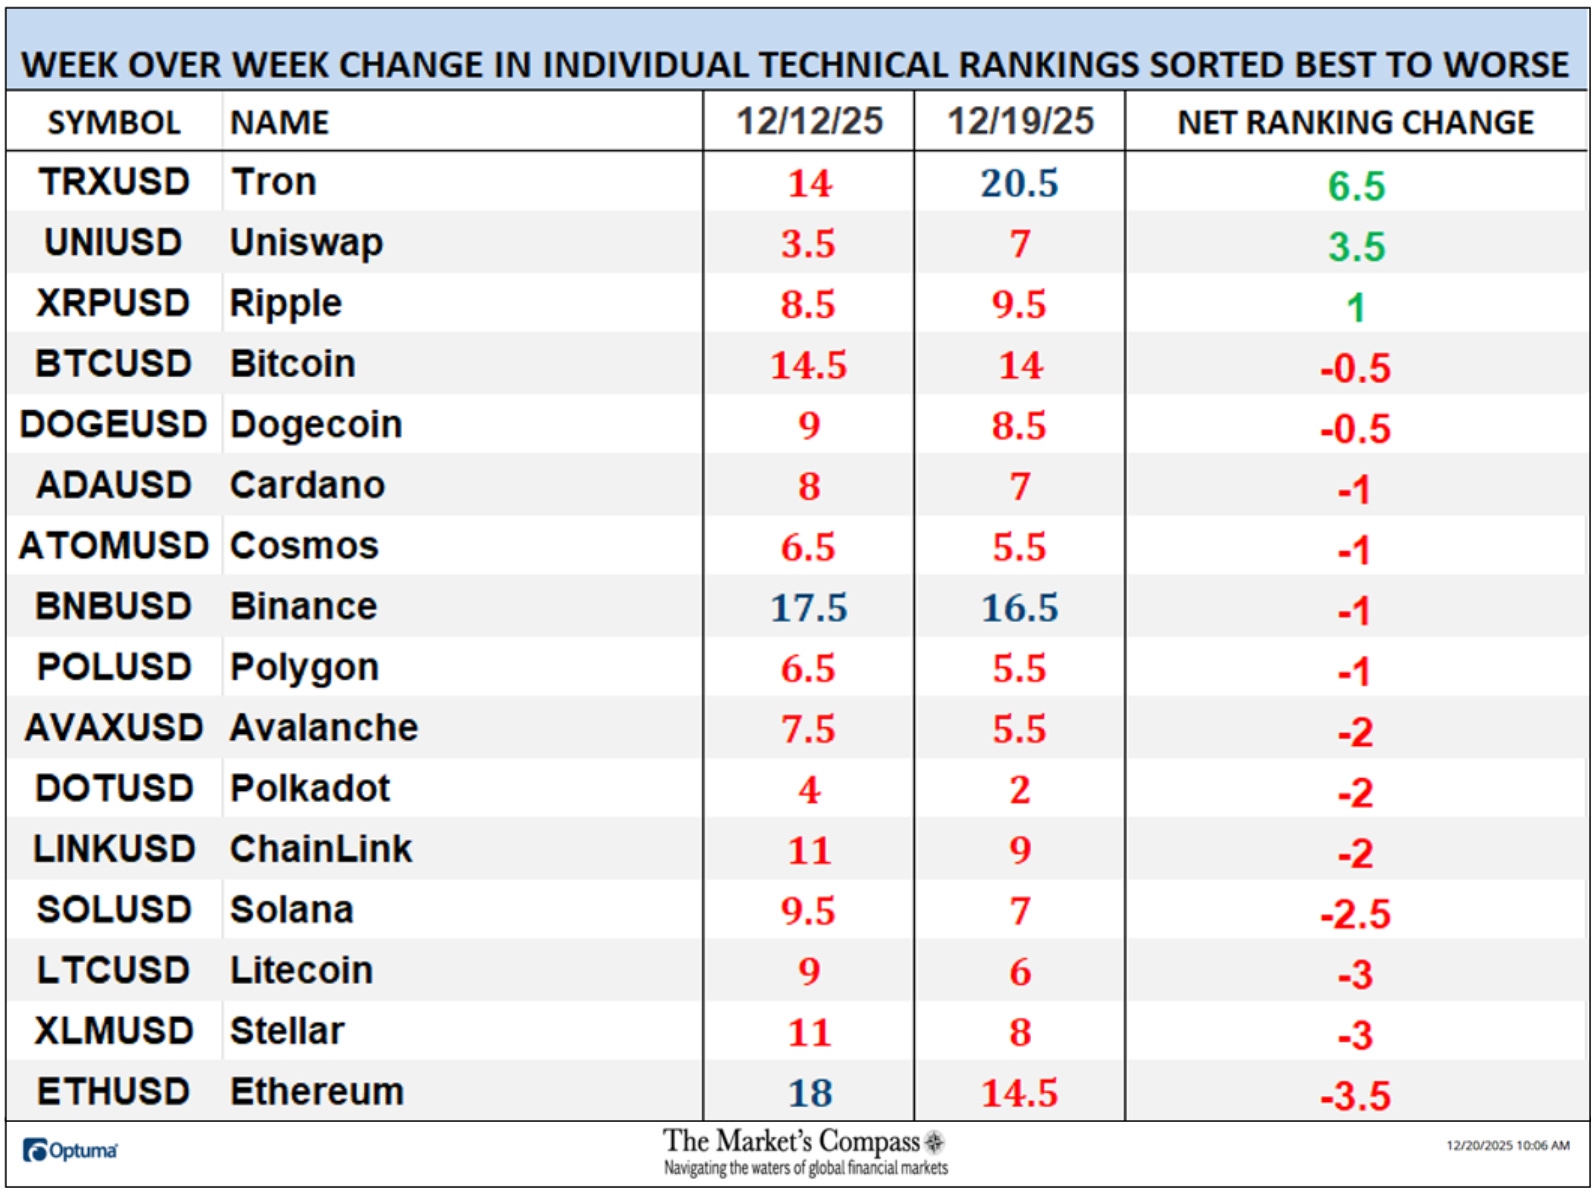
Only three of the Sweet Sixteen marked gains in their TRs last week, and thirteen moved lower. The average Sweet Sixteen TR loss was -0.75, adding to the average TR loss of -1.66 the previous week and -13.8 three weeks ago. Once again for the tenth week in a row, none of the crypto currency TRs I track ended the week in the “green zone” (TRs between 35 and 50), two were in the “blue zone” (TRs between 15.5 and 34.5) and fourteen were in the “red zone” (TRs between 0 and 15). Tron (TRX) rose into the “blue zone” (TRs between 15.5 and 34.5) and Ethereum (ETH) fell into “red zone” with Binance (BNB) remaining in the “blue zone”.
*The CCi30 Index is a registered trademark and was created and is maintained by an independent team of mathematicians, quants and fund managers lead by Igor Rivin. It is a rules-based index designed to objectively measure the overall growth, daily and long-term movement of the blockchain sector. It does so by indexing the 30 largest cryptocurrencies by market capitalization, excluding stable coins (more details can be found at CCi30.com).
The chart below has two weeks, or 14 days, of relative data points vs. the benchmark, (the CCi30 Index) at the center, deliniated by the dots or nodes. Not all of the Sweet Sixteen are plotted in this RRG Chart. I have done this for clarity purposes. Those which I believe are of higher technical interest remain.
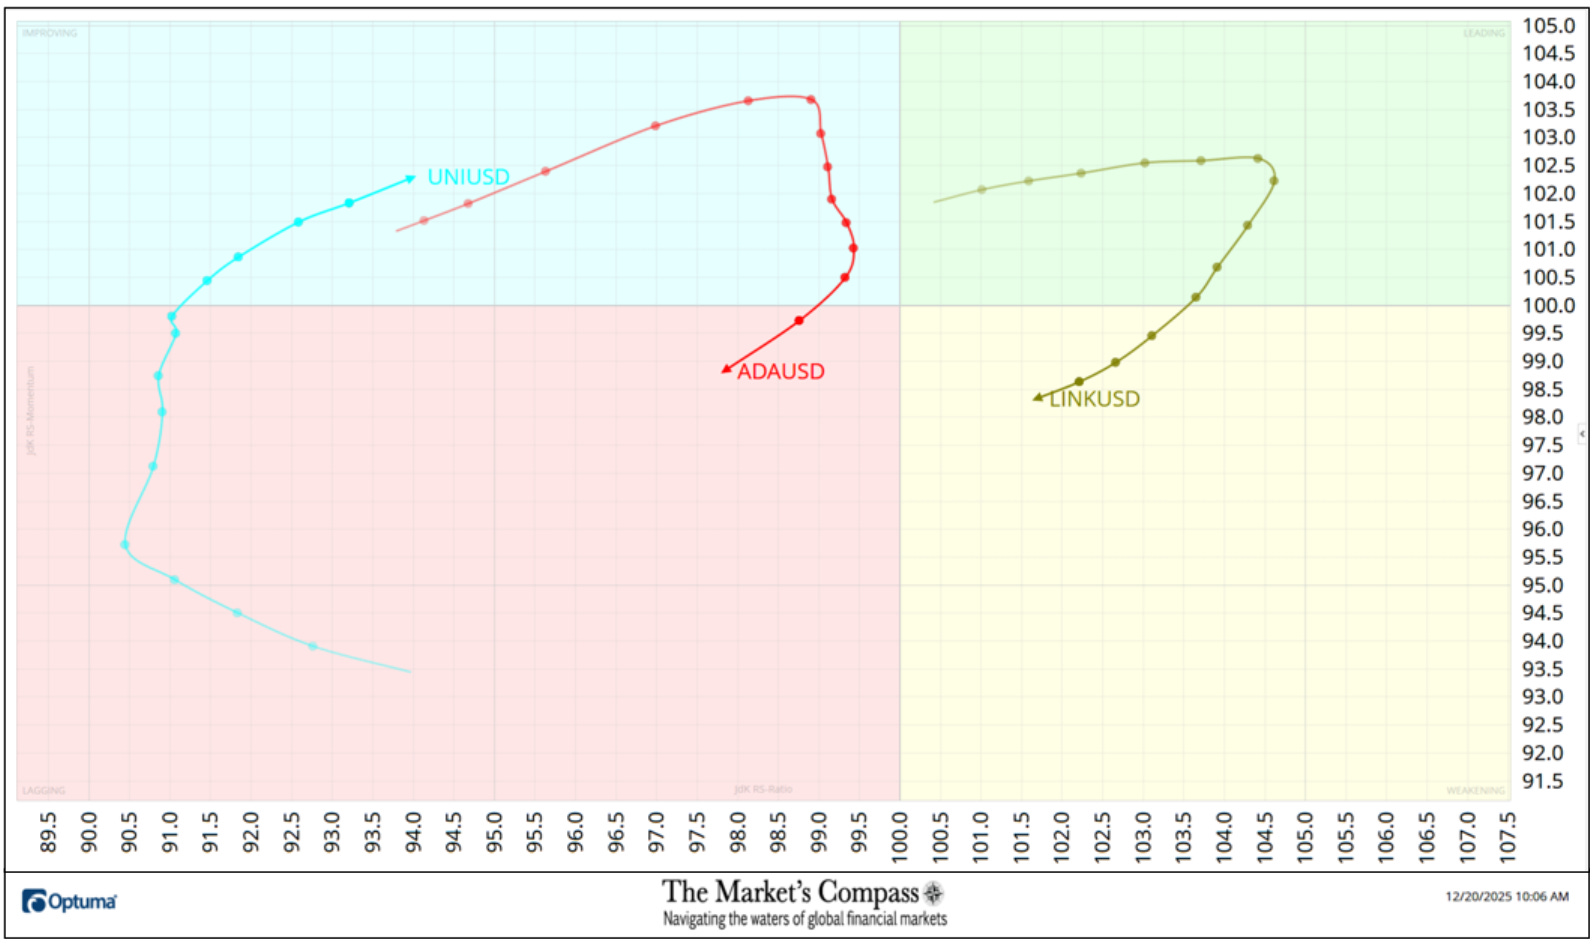
On the Friday before last, both Cardano (ADA) and ChainLink (LINK) had just started to roll over losing upside Relative Strength Momentum. Last week both strted to also lose Relative Strength and in the middle of last week ChainLink fell out of the Leading Quadrant and into the Weakening Quadrant. Cardano never made it into the Leading Quadrant and at the end of last week it fell out of the Improving Quadrant and dropped into the Lagging Quadrant. Despite improving Relative Strength momentum as it climbed out of the Lagging Quadrant and into the Improving Quadrant, Uniswap (UNI) still sports the lowest Relative Strength Ratio of the Sweet Sixteen at 94 last Friday (see the Tabulation Table below).
I have further “tweaked” the added new feature the “Tabulation Table” that now marks the Relative Strength and Relative Strength Momentum readings vs. the CCi30 Index at the end of last week and I have now added the two preceding week when we last published the Crypto Sweet Sixteen Study on 12/12. If there has been an improvement in either the Relative Strength Ratio or the Relative Strength Momentum reading since the preceding week, I have highlighted it in green. If there has been a contraction in both it is highlighted in red and an unchanged reading in either will remain black. The color-coding system has served as a heat map over the past three weeks highlighting either the continued improvement, deterioration, or stasis vs. the benchmark CCi30 Index.
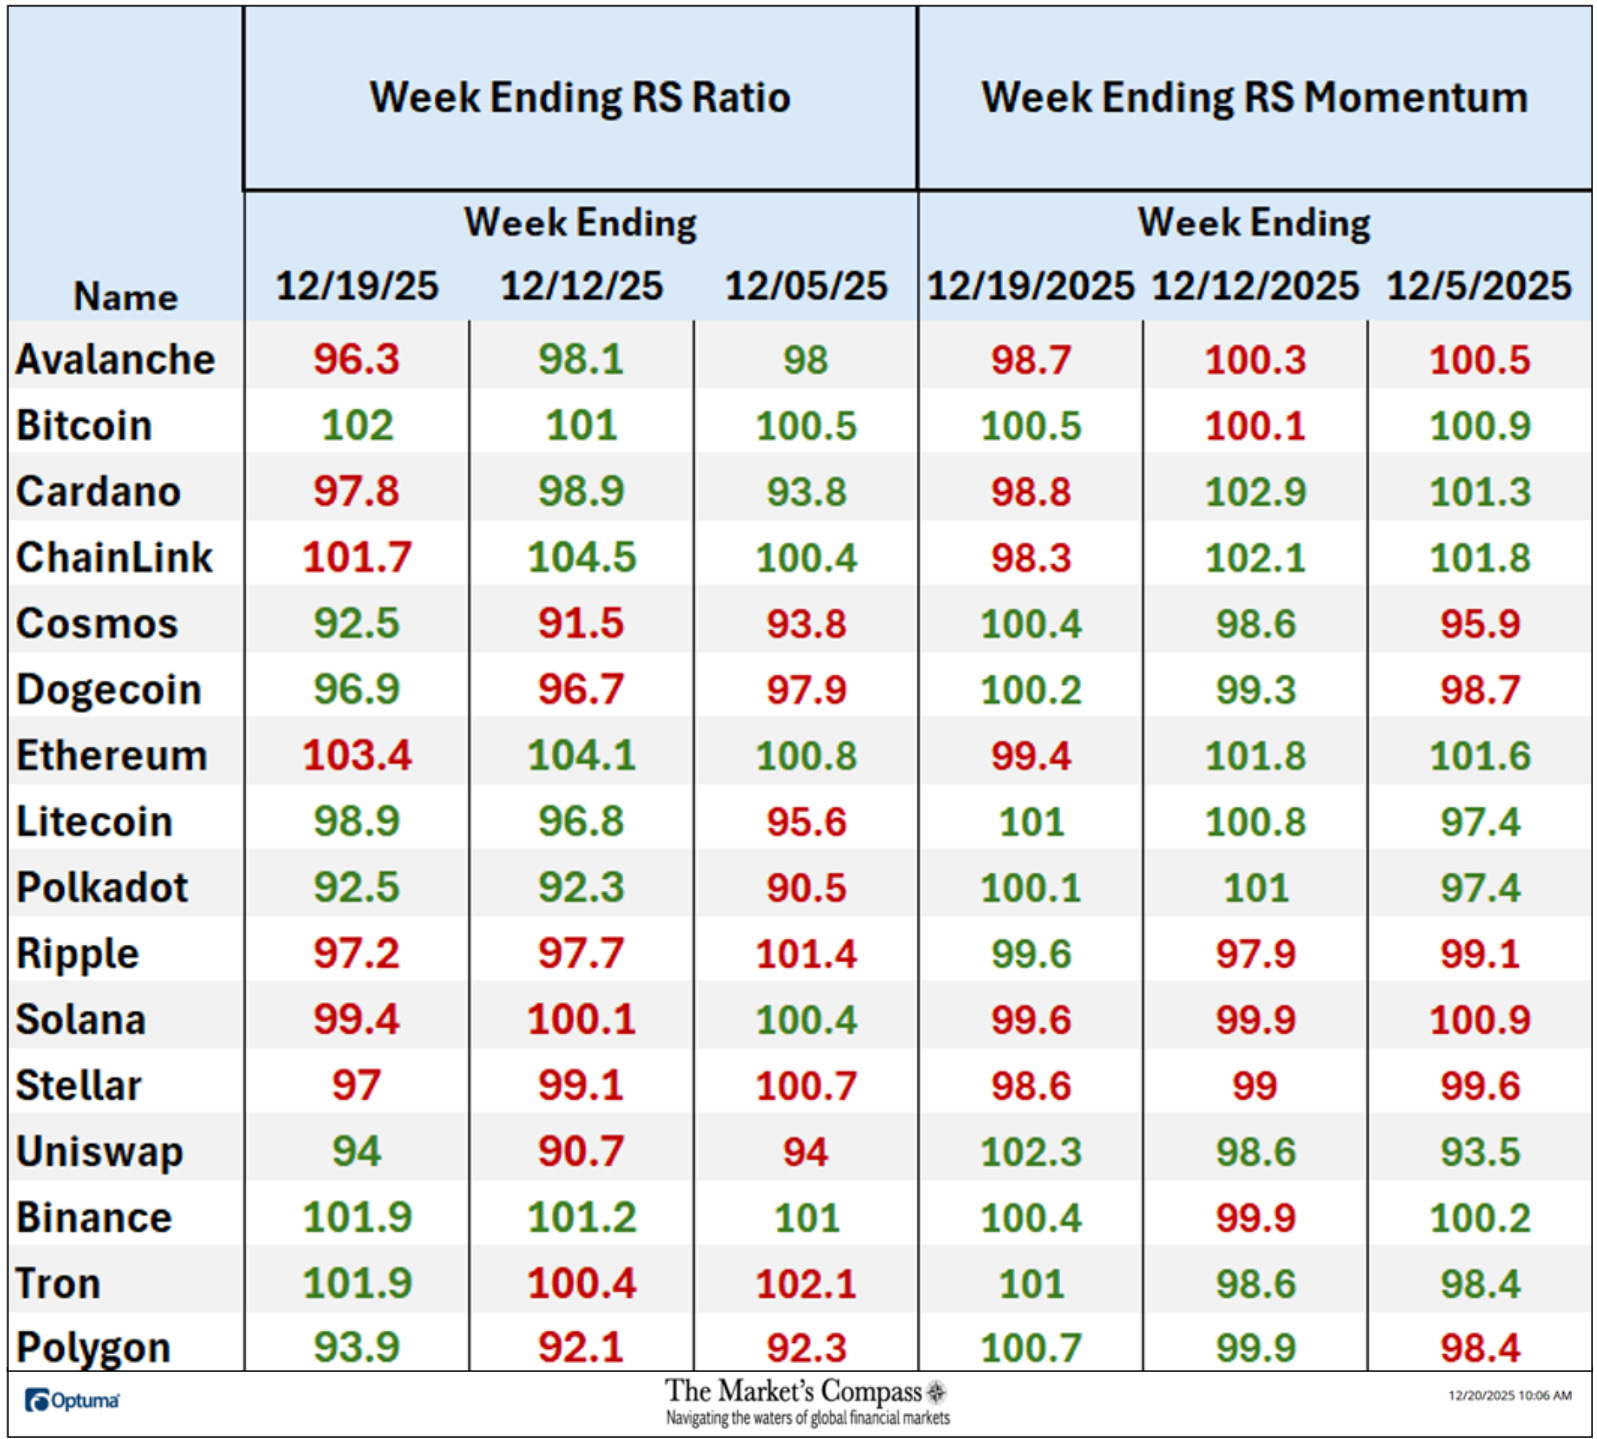
Eight of the crypto currencies registered improvements in their Relative Strength Ratios last week and ten marked an improvement in their Relative Strength Momentum and nine showed improvement in both on a week-over-week basis. Ripple (XRP) and Stellar (XMR) have displayed declining Relative Strength Ratios over the past three weeks vs. the benchmark CCi30 Index.
*Friday December 12th to Friday December 19th.
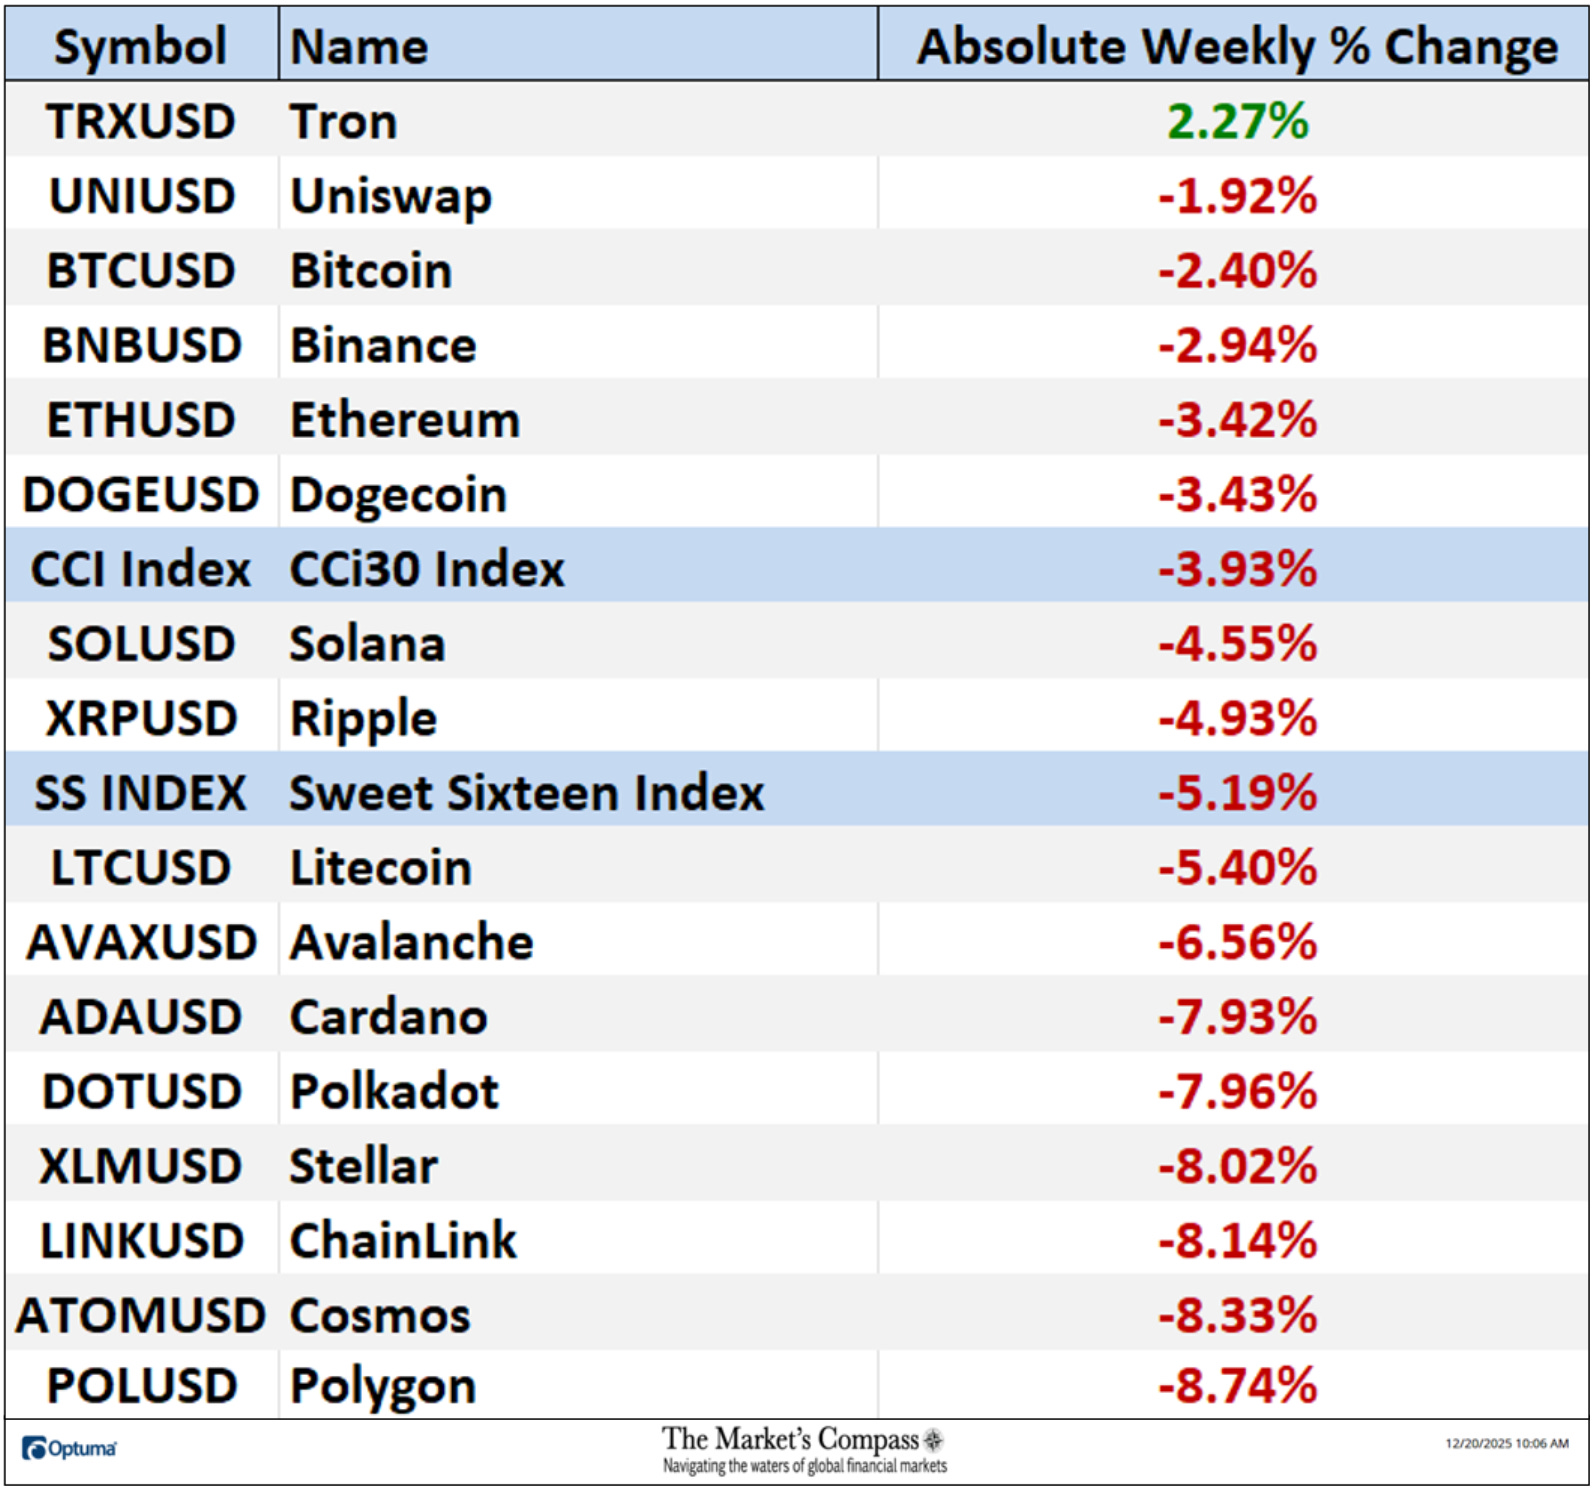
Only one of Sweet Sixteen gained ground over the past seven days (that was Tron) and fifteen continued to lose absolute ground vs. the week before when four gained absolute ground and thirteen lost absolute ground. Last week the average absolute percentage loss was -5.15% vs. the week before when the average absolute loss was -1.66%. Both weekly average moves exclude the two Indexes.
The Technical Condition Factors or TCFs are utilized in the calculation of the Individual Crypto Currencies Technical Rankings. What is shown in the excel panel below is the total TCFs of all sixteen TRs. A few TCFs carry more weight than the others, such as the Weekly Trend Factor and the Weekly Momentum Factor in compiling each individual TR of each of the 16 Cryptocurrencies. Because of that, the excel sheet below calculates each factor’s weekly reading as a percentage of the possible total.
A full explanation of my Technical Condition Factors go to www.themarketscompass.com. Then go to the MC’s Technical Indicators and select Crypto Sweet 16.
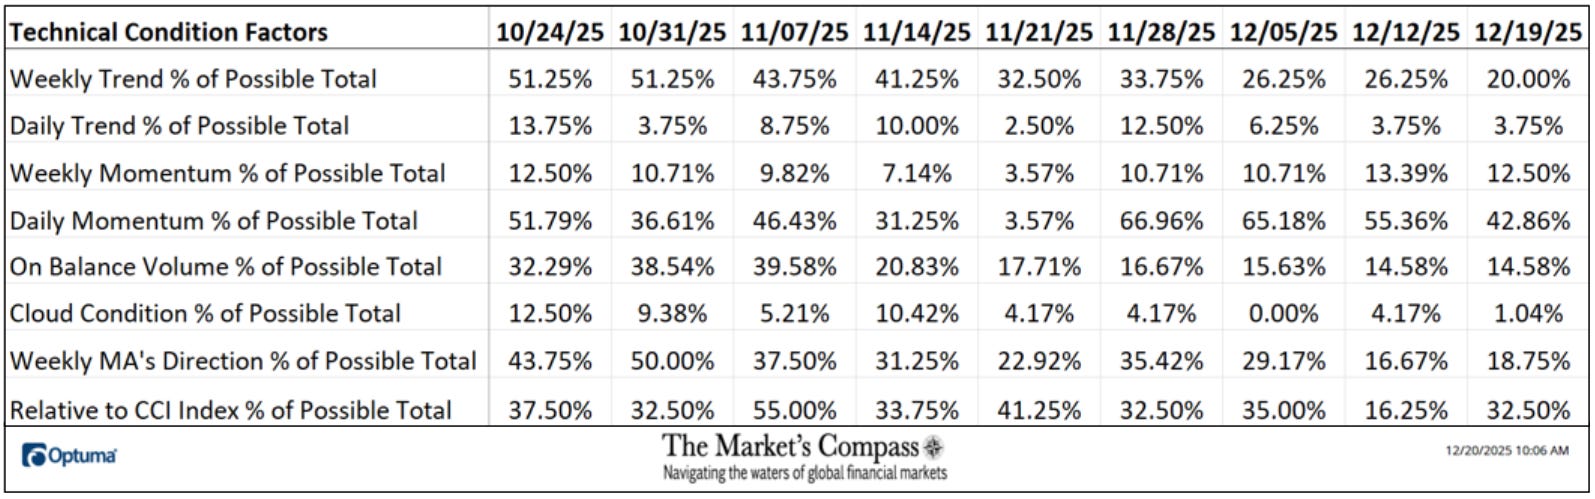
The Daily Momentum Technical Condition Factor or “DMTCF” fell to 42.86% or 48 out of a posible 112 from 55.36% or 62 out of a possible 112 at the end of previous week markin the fourth week of declines. Note that the Daily Trend Condition Factor has remained unchanged at 3.75% or 3 out of a possible 80.
As a confirmation tool, if all eight TCFs improve on a week over week basis, more of the 16 Cryptocurrencies are improving internally on a technical basis, confirming a broader market move higher (think of an advance/decline calculation). Conversely, if more of the TCFs fall on a week over week basis, more of the “Cryptos” are deteriorating on a technical basis confirming the broader market move lower. Last week only two of the TCFs rose, four fell, and two were unchanged vs. the week before when two were higher, five TCFs contracted and one was unchanged.
*The “TSSTCF” Oscillator tallies the eight objective Technical Condition Factors into one overbought / oversold indicator that ranges between 0 and 8.
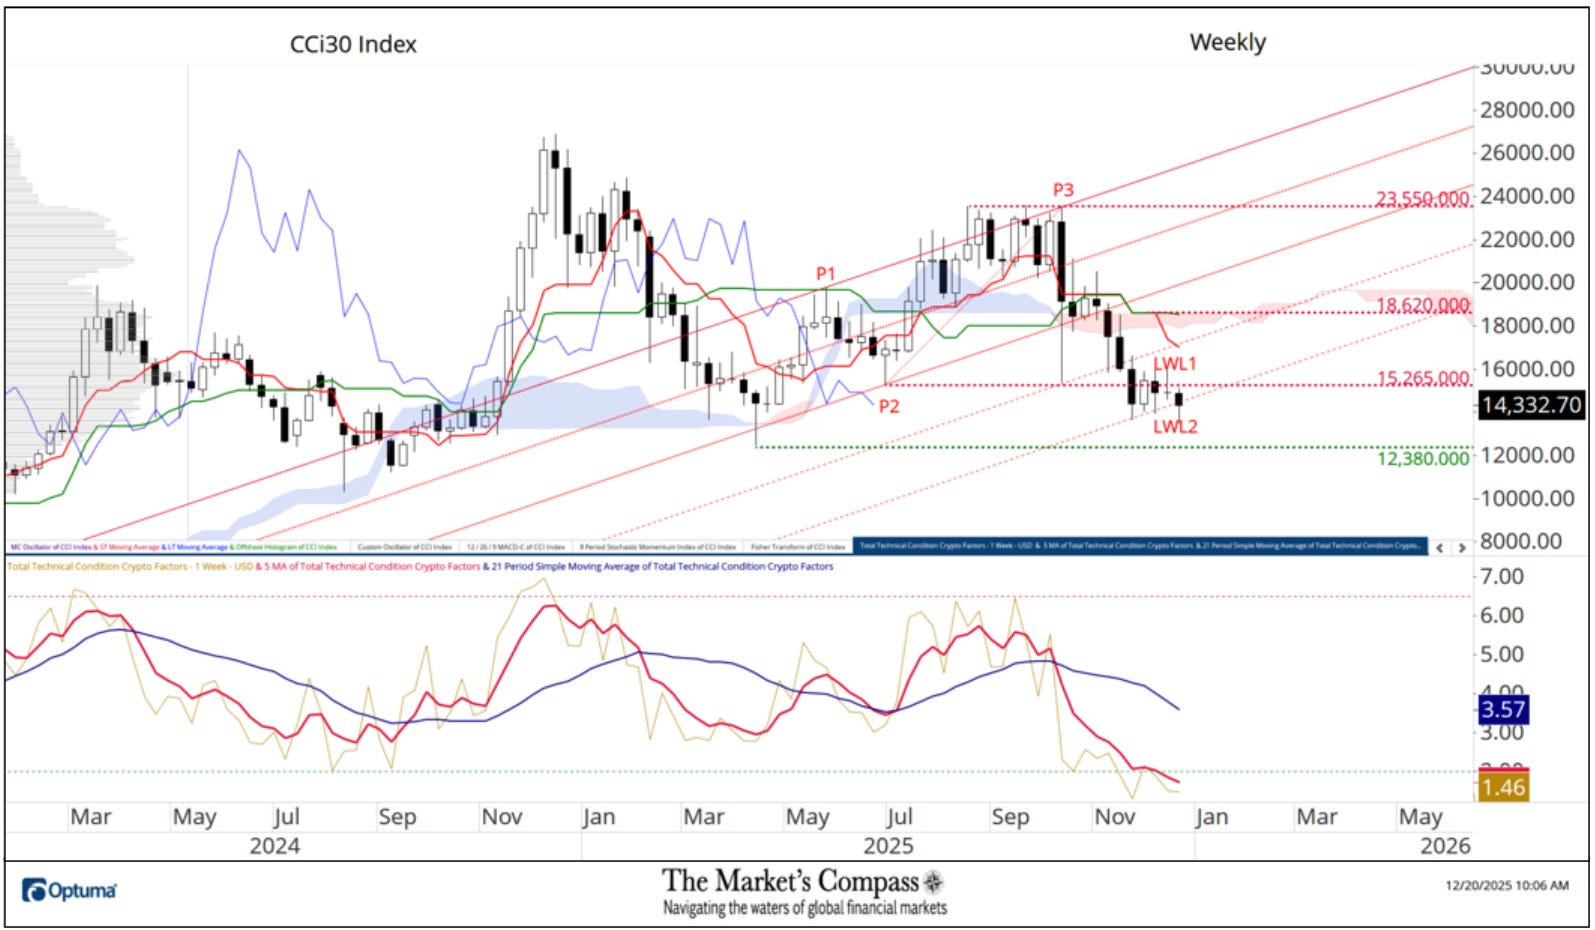
The CCi30 Index has churned sideways for five weeks, but last week the Index closed just below potential support at the second Lower Warning (red LWL2). Although it was a minor violation at the end of last week, it nonetheless does not give solace to the beleaguered bulls and suggests that key support will most likely be tested at the intra-week April 11th lows at 12,380. With it, the Total Technical Condition Crypto Factor Oscillator remains mired in oversold territory below its shorter-term 5-Week Moving Average (red line).
For a explanation on how to interpret the Sweet Sixteen Total Technical Ranking or “SSTTR” vs the weekly price chart of the CCi30 Index in the lower panel, go to www.themarketscompass.com. Then go to the MC’s Technical Indicators and select Crypto Sweet 16. A brief explanation follows…
The Sweet Sixteen Total Technical Ranking (“SSTTR”) Indicator (bottom panel in the chart below) is a total of all 16 Cryptocurrency Individual Technical Rankings and can be looked at as a confirmation/divergence indicator as well as an overbought/oversold indicator
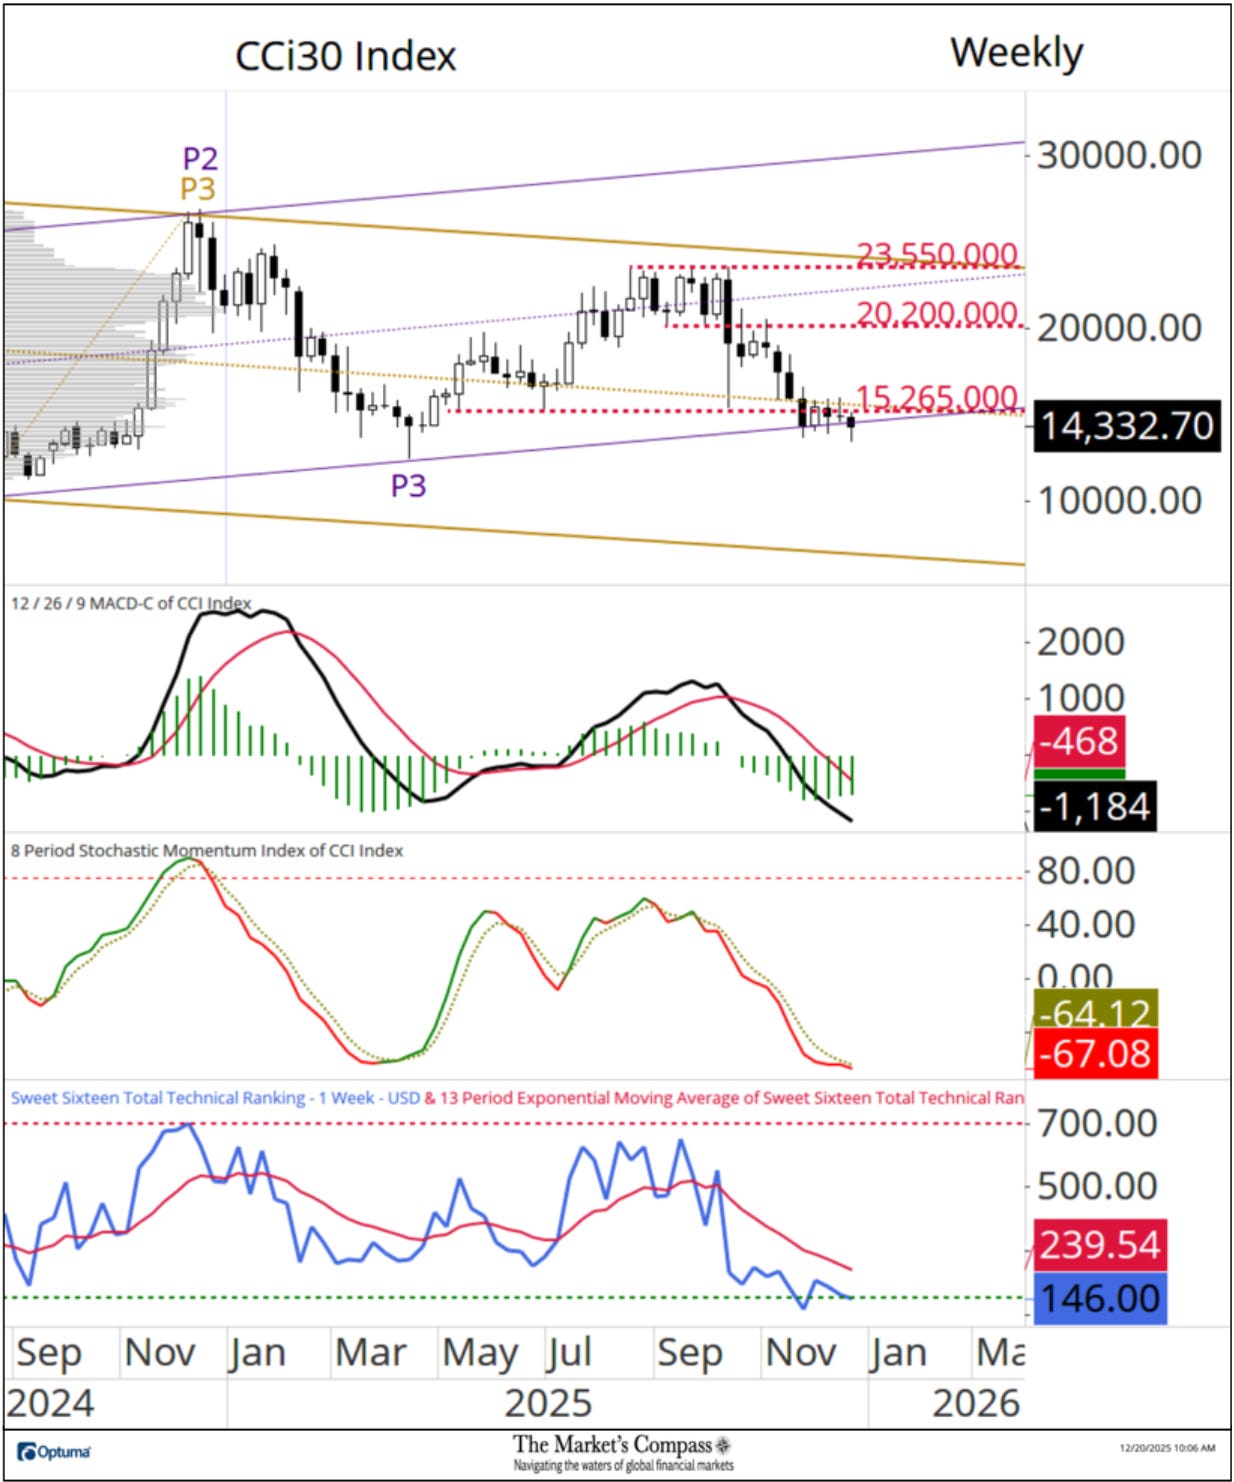
The longer-term Weekly chart does not paint a rosier picture, with a close below the Lower Parallel (solid violet line) of the longer-term Schiff Modified Pitchfork (violet P1-P3). MACD continues to track lower below its signal line and although the shorter-term Stochastic Momentum Index is in oversold territory it also remains below its signal line. Another of my proprietary oscillators, the Sweet Sixteen Total Technical Ranking indicator, is still in oversold territory and there is not a hint of a turn higher.
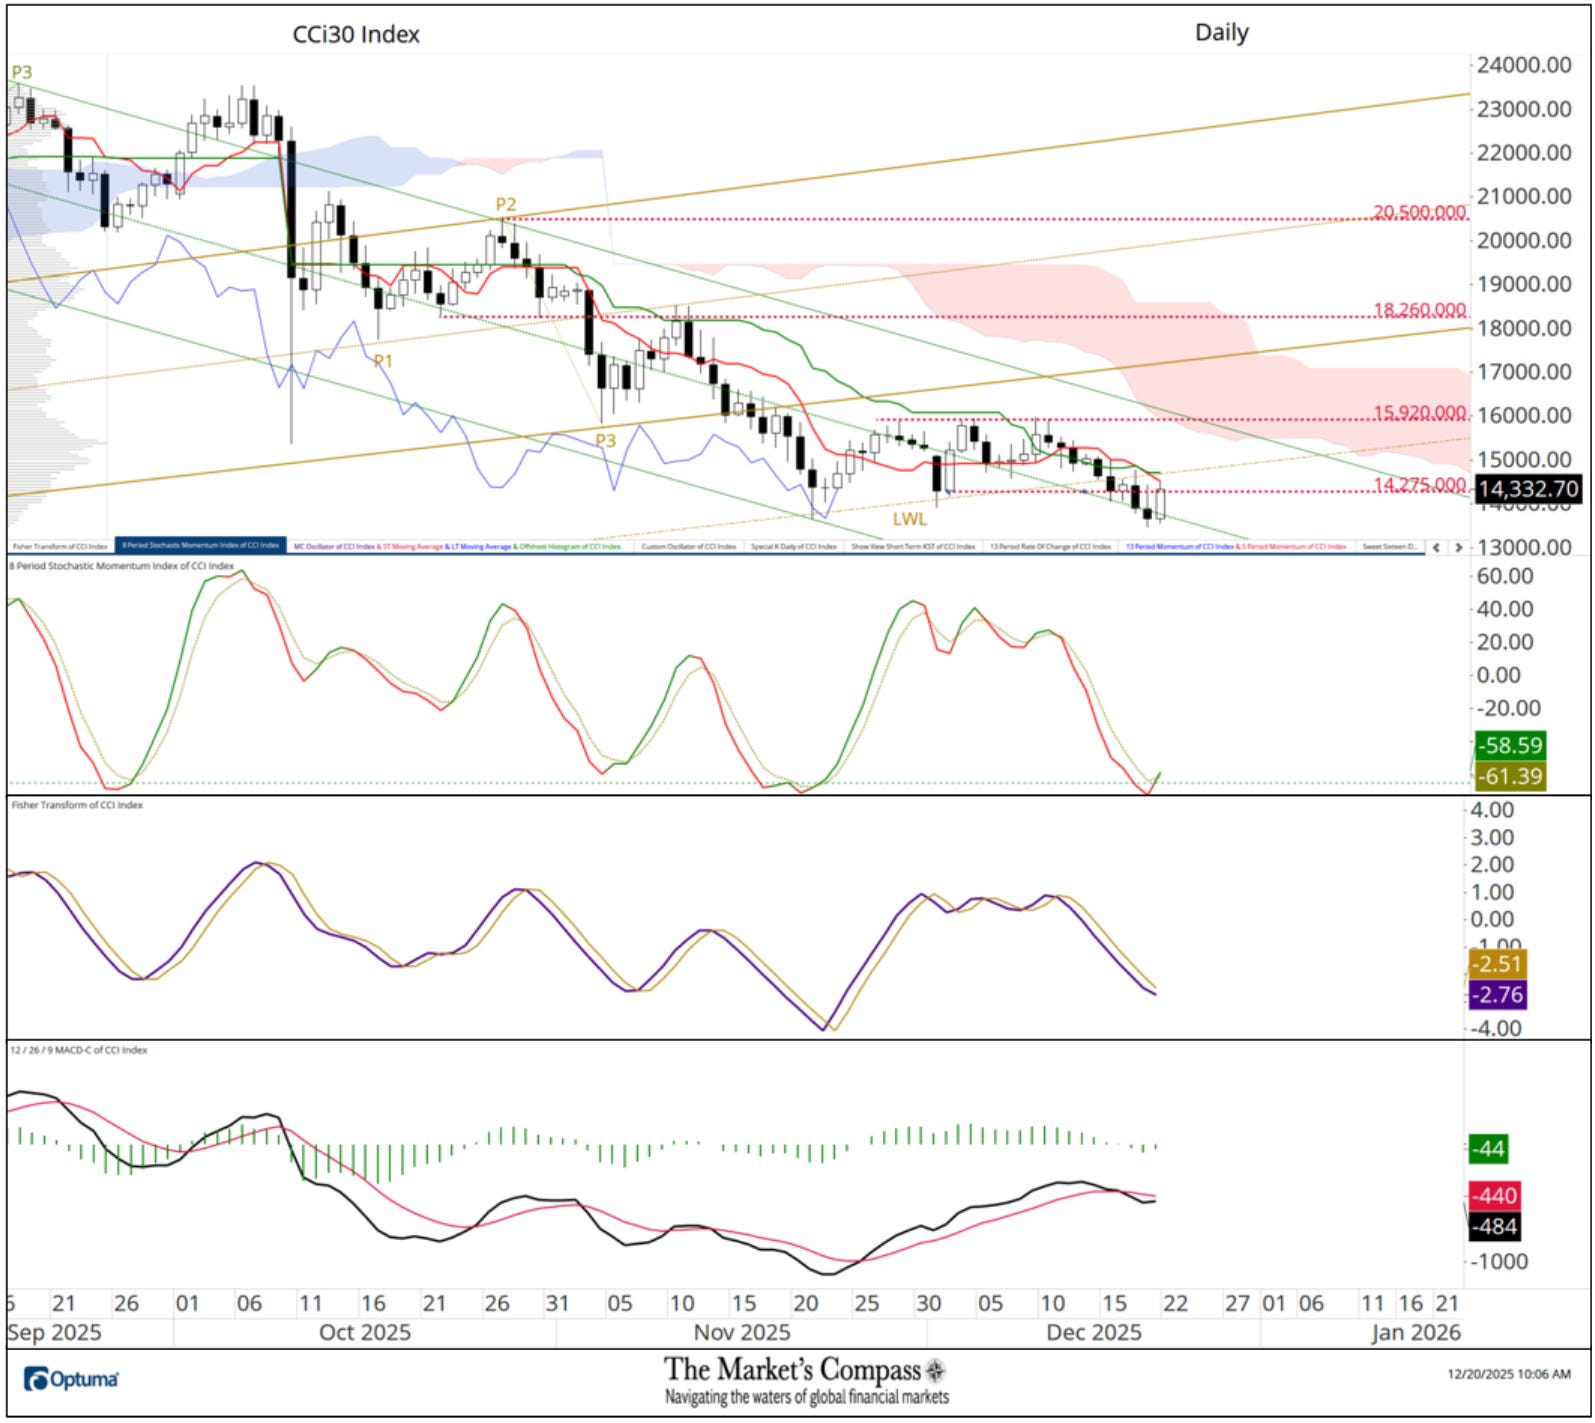
The CCi30 Index managed to bounce on Friday, recovering the ground above the Median Line (green dotted line) of the longer-term Standard Pitchfork (green P1 -P3) but it remains capped by the Tankan Plot (red line) and the Lower Warning Line (gold LWL) of the shorter-term Standard Pitchfork (gold P1-P3). The 8-Day Stochastic Momentum Index has turned up through its signal line in oversold territory (a minor short-term technical positive). Since I last published last week MACD has rolled over through its signal line but appears to be stabilizing. Neither of these technical features are enough to suggest Friday’s rally could lead to measurable counter trend rally.
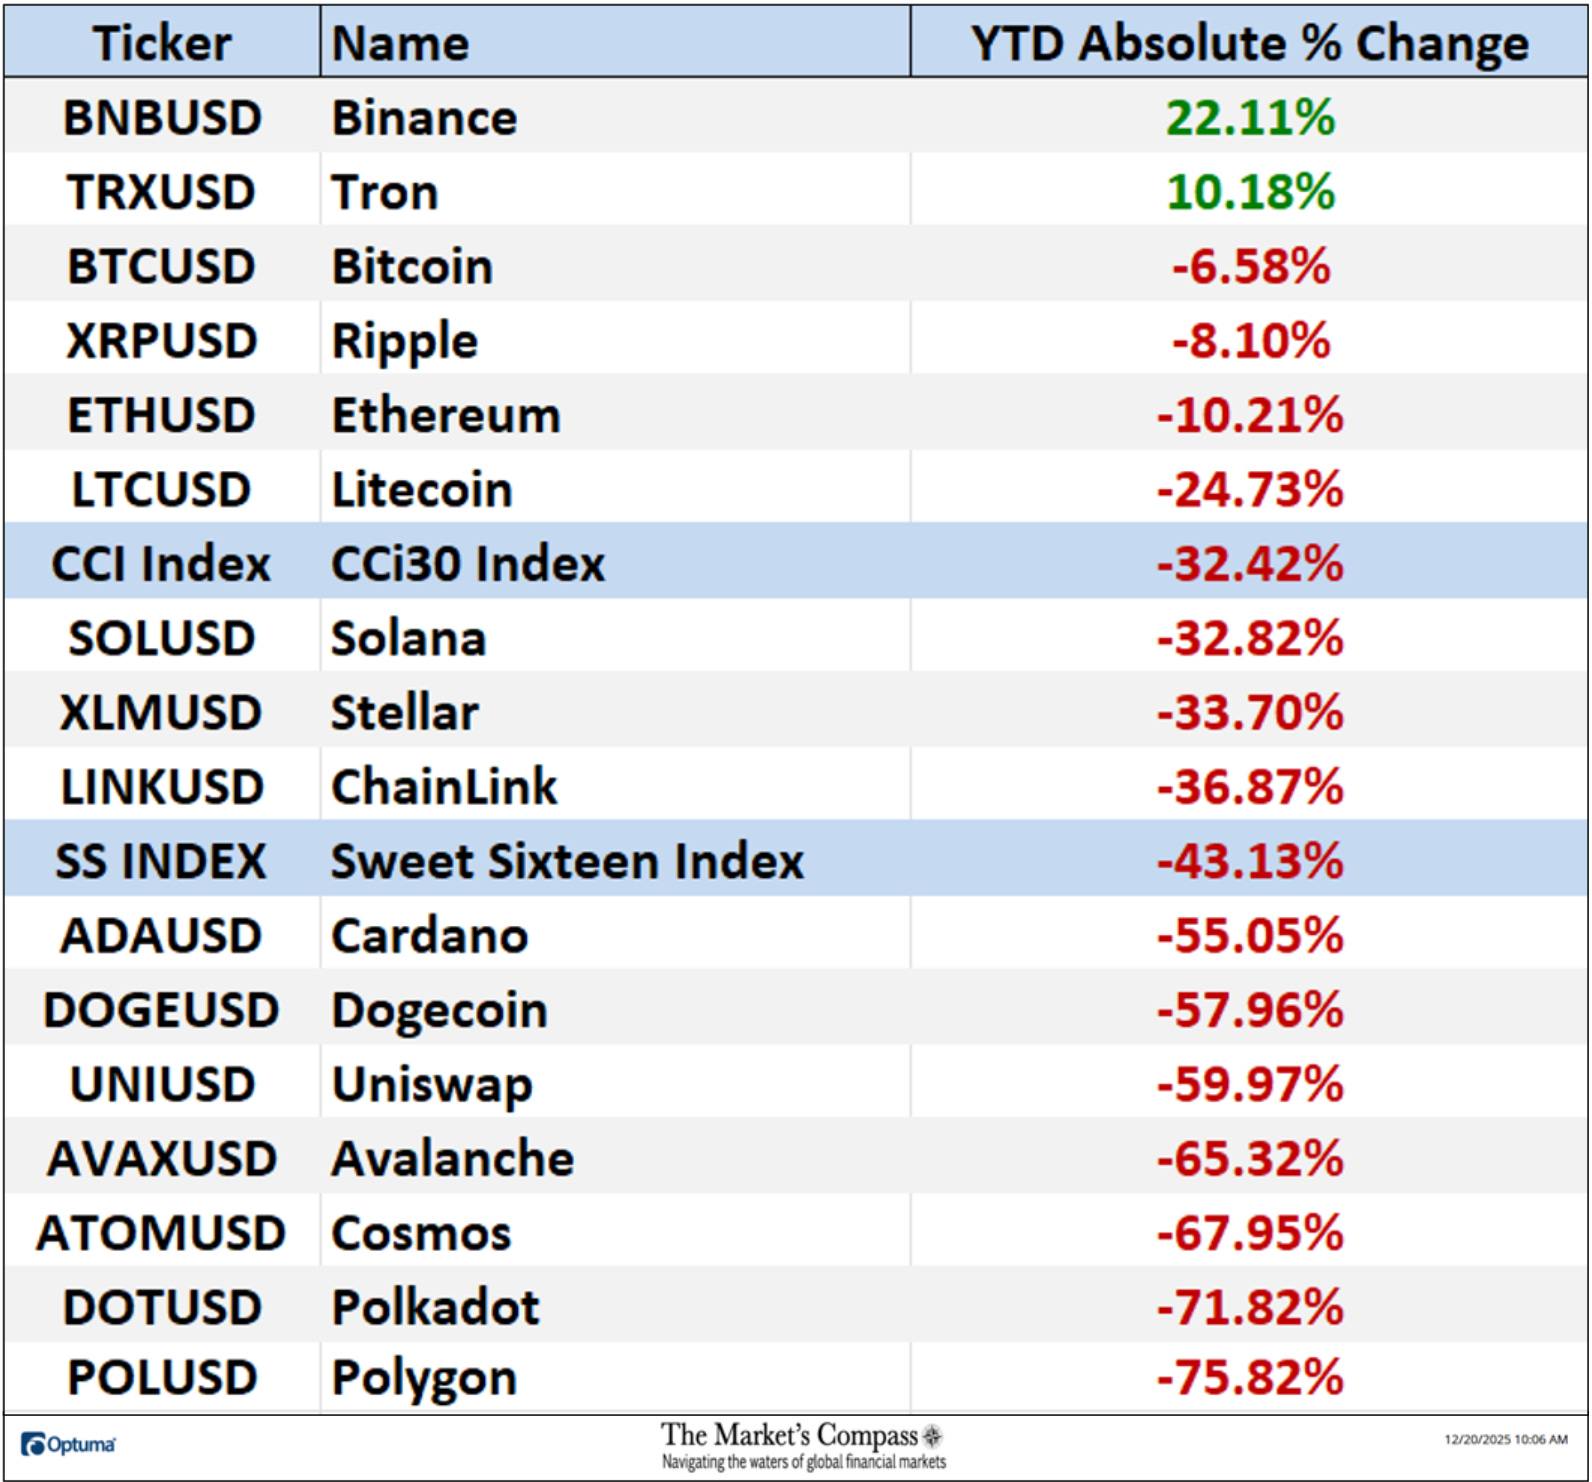
Last week the YTD Absolute % Price Change of the Sweet Sixteen fell back to end the week at -35.91% from -33.11% the week before with only Binance (BNB) and Tron (TRX) marking YTD Absolute gains.
The following links are an introduction and an in-depth tutorial on RRG Charts…
https://www.optuma.com/videos/introduction-to-rrg/
https://www.optuma.com/videos/optuma-webinar-2-rrgs/
To receive a 30-day trial of Optuma charting software go to…
An in-depth comprehensive lesson on Pitchforks and analysis as well as a basic tutorial on the Tools of Technical Analysis is available on my website…