


The past few weeks have been highly volatile for bitcoin (BTC), with price action reflecting sharp swings. In the past two weeks bitcoin traded on an open-high, lower-close candlestick pattern with double-digit percentage differences.
The week beginning Feb. 24 saw bitcoin drop to a low of $78,167 and climb to a high of $96,515, a 23% swing. The following week, starting Mar. 3, recorded a low of $81,444 and a high of $94,415, marking a 16% swing.


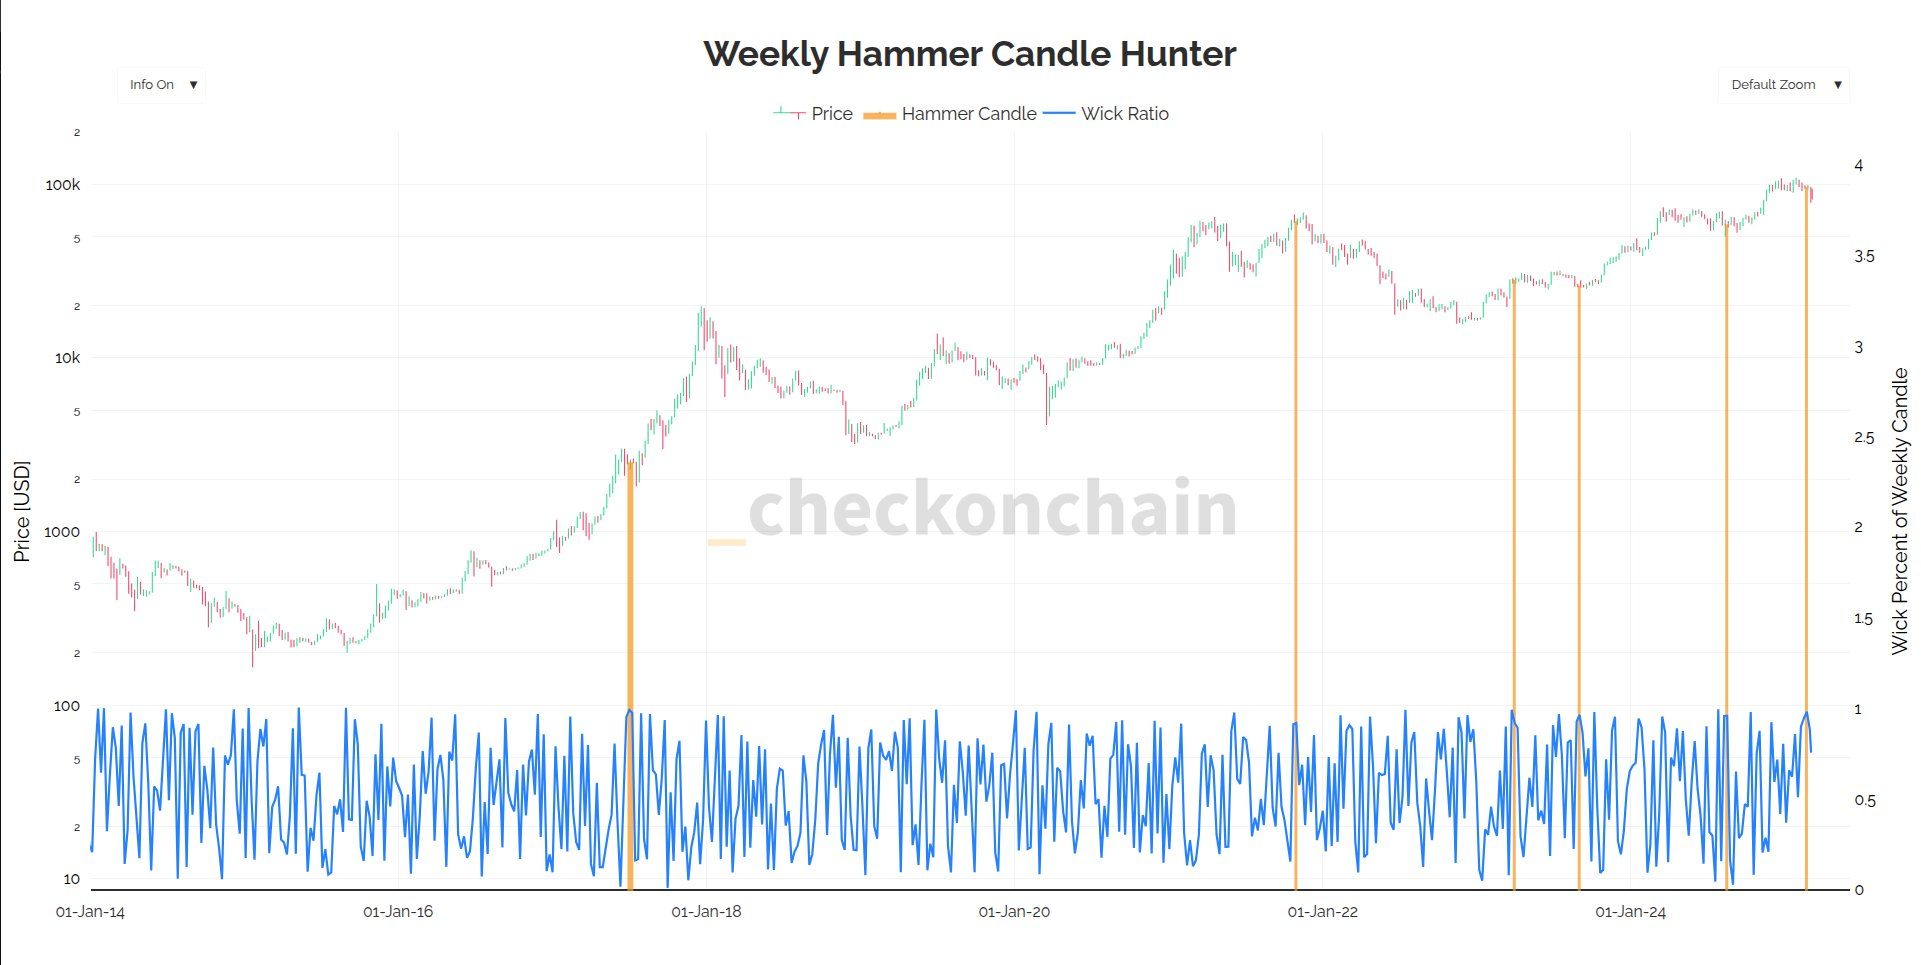
These large candlestick formations are known as hammer candles, as defined by analyst Checkmate, where the lower or upper wick makes up 90% of the total price range, leaving a small body with a long wick.
Checkmate’s analysis shows that Bitcoin has formed a weekly hammer candle with a 90% lower wick only five times in its history. These instances occurred during the 2017 bull run, the late 2021 bull market peak near $69,000, twice in 2023—following the Silicon Valley Bank crisis and again after the summer downturn—and once in 2024, also during a summer lull.
While the data does not show a clear pattern in bitcoin’s cycle, the 2017 bull market correction stands out, suggesting that such formations could signal critical turning points in price trends.