


Welcome to The Market’s Compass US Index and Sector ETF Study, Week #492. As always it highlights the technical changes of the 30 US Index and Sector ETFs that I track on a weekly basis and normally publish every third week. Paid subscribers will receive this week’s unabridged Market’s Compass US Index and Sector ETF Study sent to their registered e-mail. Free subscribers on occasion will receive an excerpt of the full version. Past publications can be accessed by paid subscribers via The Market’s Compass Substack Blog.


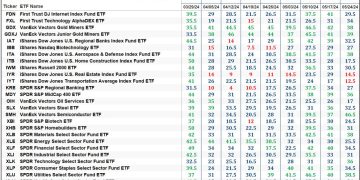
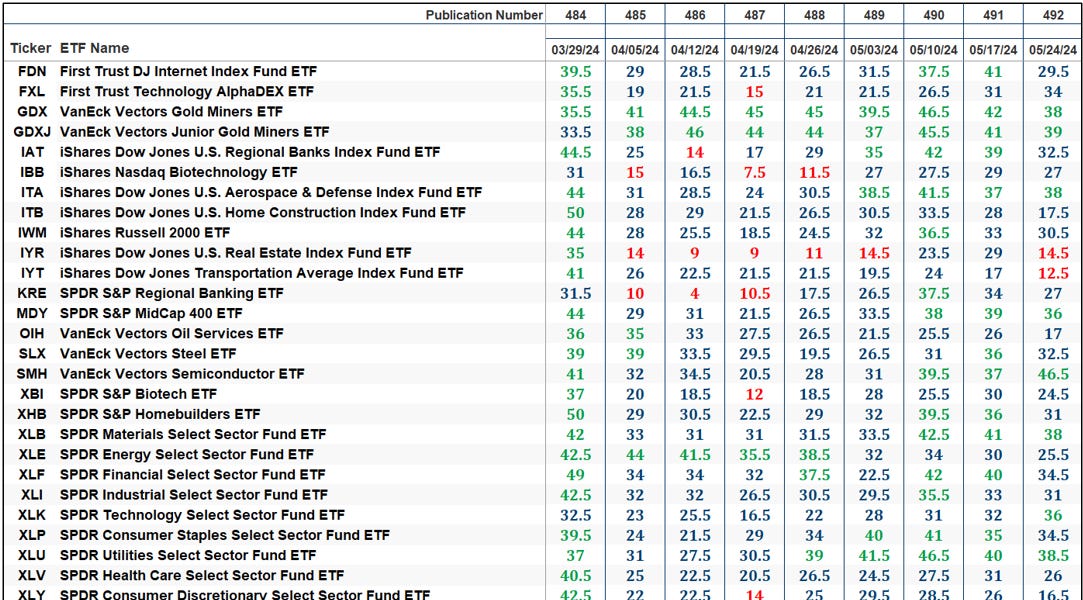
The Excel spreadsheet below indicates the weekly change in the objective Technical Ranking (“TR”) of each individual ETF. The technical ranking or scoring system is an entirely quantitative approach that utilizes multiple technical considerations that include but are not limited to trend, momentum, measurements of accumulation/distribution and relative strength. If an individual ETFs technical condition improves the Technical Ranking TR rises and conversely if the technical condition continues to deteriorate the TR falls. The TR of each individual ETF ranges from 0 to 50. The primary take away from this spread sheet should be the trend of the individual TRs, either the continued improvement or deterioration, as well as a change in direction. Secondarily, a very low ranking can signal an oversold condition and conversely a continued very high number can be viewed as an overbought condition, but with due warning, oversold conditions can continue at apace and overbought securities that have exhibited extraordinary momentum can easily become more overbought. In addition, if an individual TR “can’t “get out of its own way” while the broader market continues to rally it speaks volumes about poor relative strength. A sustained trend change needs to unfold in the TR for it to be actionable.
The Total ETF Ranking or “TER”, fell by -10.44% to 913.5 from the week before which was a drop of -4.09% from the week ending May 17th which registered a reading of 1020. Both readings in the TER failed to confirm the new closing price high on May 17th 5,303.27 and last week”s nominal closing high of 5,304.72 (see S&P 500 Index and “TER” chart later in the Blog) It paid to pay attention to the overbought reading of 1214 at the end of March. I will bring forth other non-confirmations of the new price highs later in the Blog.
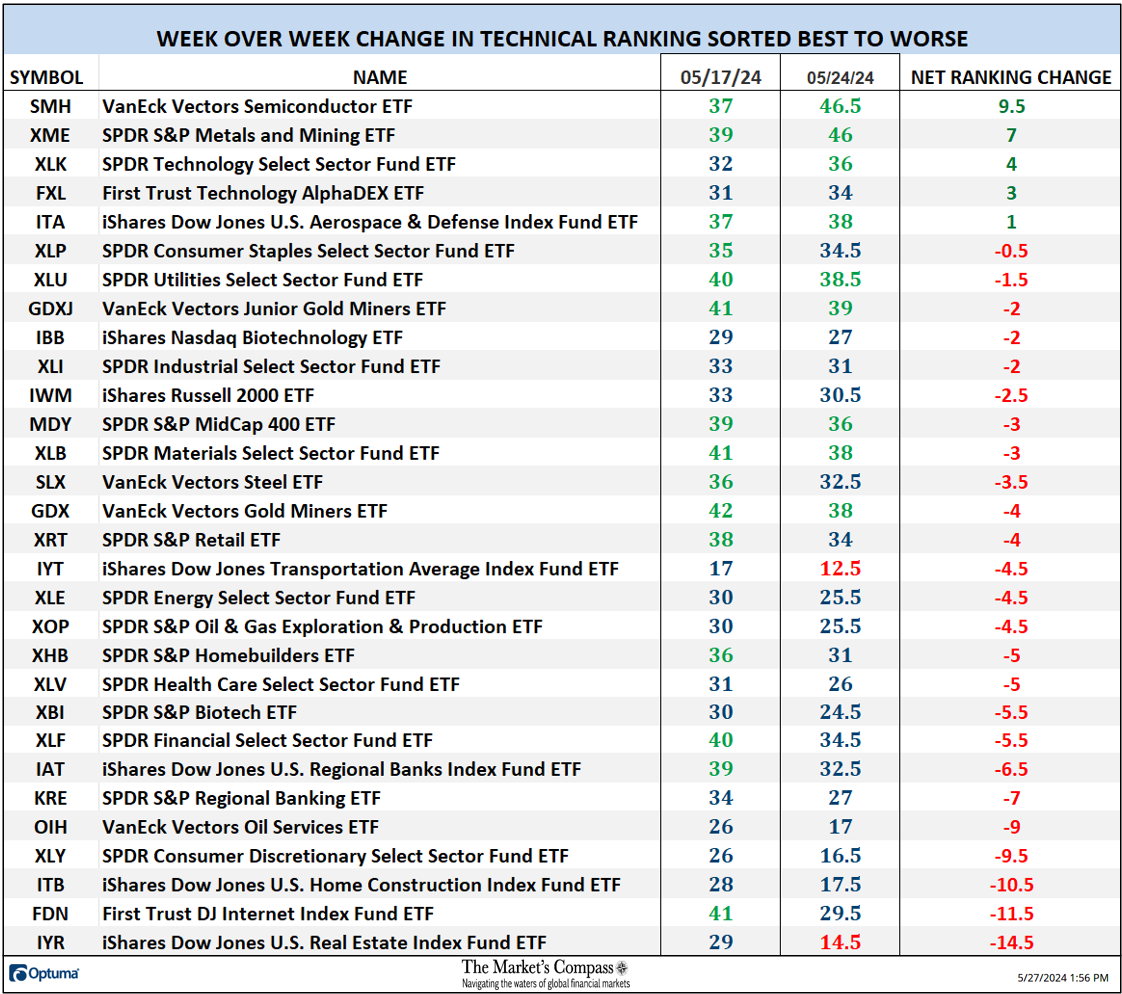
On a week over week basis twenty-five ETFs saw losses in their Technical Rankings, (“TRs”), and five had TRs that gained ground. The average TR loss last week was -3.55 vs. a average TR loss the week before of -1.45. At the end of last week nine ETFs were in the “green zone” (TRs between 35-50), nineteen ETFs were in the “blue zone” (TRs from 15.5 -34.5) and two in the “red zone” (TRs from 0-15) versus the week before when there were fifteen in the “green zone” and fifteen were in the “blue zone” marking a noticeable technical deterioration even though the SPX was basically unchanged. To me that suggests a negative concerns regarding breadth.
Understanding the Technical Condition Factors and their Week over Week Changes
There are eight Technical Condition Factors (“TCFs”) that determine individual TR scores (0-50). Each of these 8, ask objective technical questions. If a technical question is positive an additional point is added to the individual TR. Conversely if the technical question is negative, it receives a “0”. A few TCFs carry more weight than the others such as the Weekly Trend Factor and the Weekly Momentum Factor in compiling each individual TR of each of the 30 ETFs. Because of that, the excel sheet below calculates each Factor’s weekly reading as a percent of the possible total. For example, there are 7 considerations (or questions) in the Daily Momentum Condition Factor (“DMC”) of the 30 ETFs (or 7 X 30) for a possible range of 0-210 if all 30 ETFs had fulfilled the DMC Factor criteria the reading would be 210 or 100%.
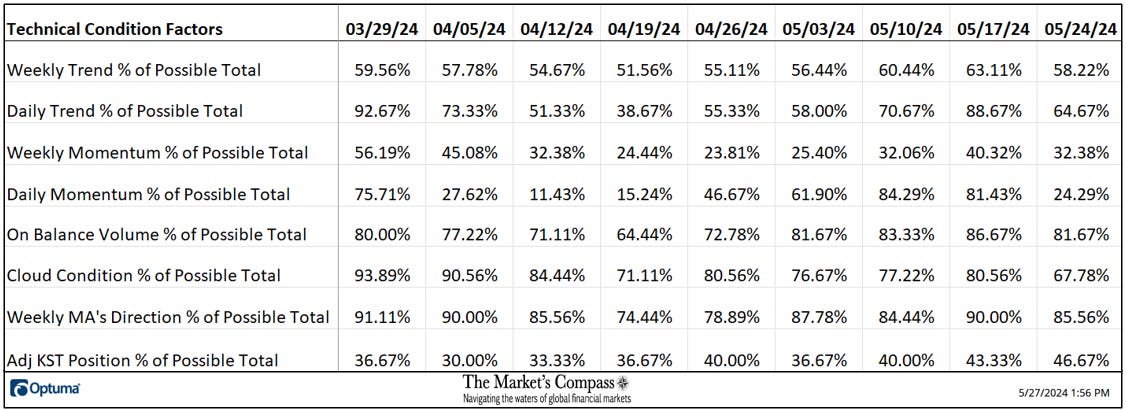
One technical takeaway would be if the DMC Factor rises to an extreme between 85% and 100% it would suggest a short-term overbought condition. Conversely a reading in the range of 0% to 15% would suggest an oversold condition was developing. This past week a 24.44% reading of the DMC Factor was registered, or 51 of a possible total of 210 positive points which marked a sharp drop (another non-confirmation of new price highs). The week before, the DMC Factor was 81.43% or 171 of a possible total of 210 positive points.
As a confirmation tool, if all eight TCFs improve on a week over week basis, more of the 30 ETFs are improving internally on a technical basis confirming a broader market move higher (think of an advance/decline calculation). Conversely if all eight TCFs fell over the week it confirms a move lower in the broader market. Last week seven fell vs. the previous week when seven gained ground and one fell. Need I say more? I don’t think so.
The “TER” Indicator is a total of all 30 individual ETF rankings and can be looked at as an additional confirmation/divergence indicator as well as an overbought oversold indicator. As a confirmation/divergence tool: If the broader market as measured by the S&P 500 Index (SPX) continues to rally without a commensurate move or higher move in the “TER” the continued rally in the SPX Index becomes increasingly in jeopardy. Conversely, if the SPX Index continues to print lower lows and there is little change or a building improvement in the “TER” a positive divergence is registered. This is, in a fashion, like a traditional A/D Line. As an overbought/oversold indicator: The closer the “TER” gets to the 1500 level (all 30 ETFs having a “TR” of 50) “things can’t get much better technically” and a growing number individual ETFs have become “stretched” the more of a chance of a pullback in the SPX Index, On the flip side the closer to an extreme low “things can’t get much worse technically” and a growing number of ETFs are “washed out technically” an oversold rally or measurable low is close to being in place. The 13-week exponential moving average (red line) smooths the volatile “TER” readings and analytically is a better indicator of trend.
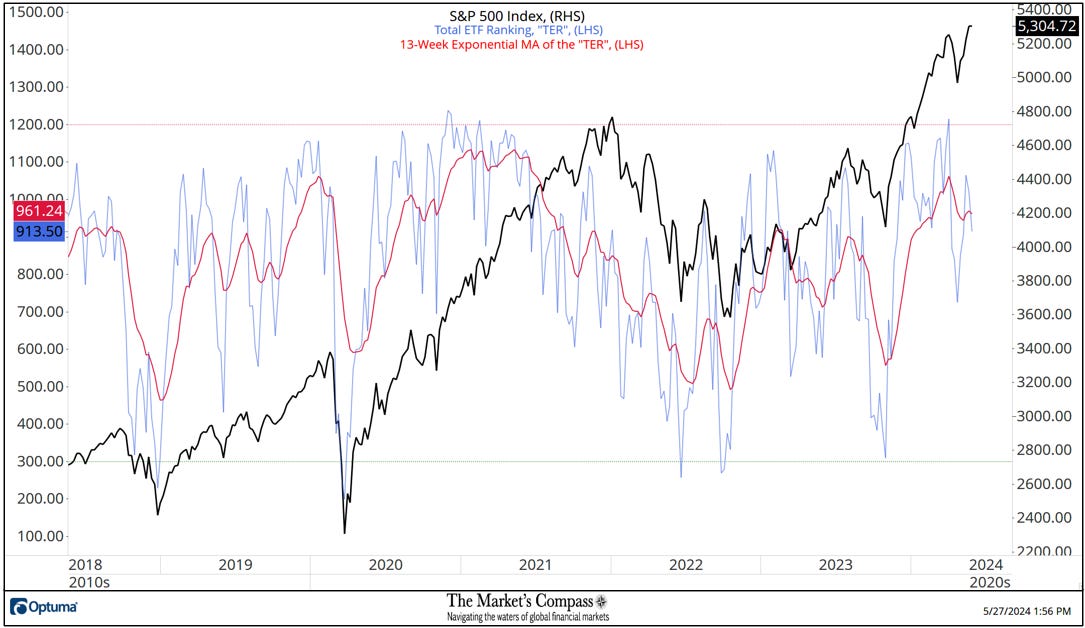
On a Wow basis the SPX Index rose less than two points to end last week at 5,304.72. As will be seen later in the Blog that belies the nasty sell off last Thursday. Of more technical importance is that the Total ETF Ranking, or TER, fell over the past two weeks, down -10.44% and -4.09% respectively, in what is a budding non-confirmation of the recent price highs in concert with the 13-Week Exponential MA rolling over. It would be premature to declare that this signals that even a short-term top is in place but it is an early technical concern. More on that subject later in “Thoughts on the short-term technical condition of the SPX Index” later in this week’s Blog.
The Weekly Average Technical Ranking (“ATR”) is the average Technical Ranking of the 30 US Index and Sector ETFs we track. Like the TER, it is a confirmation/divergence or overbought/oversold indicator.
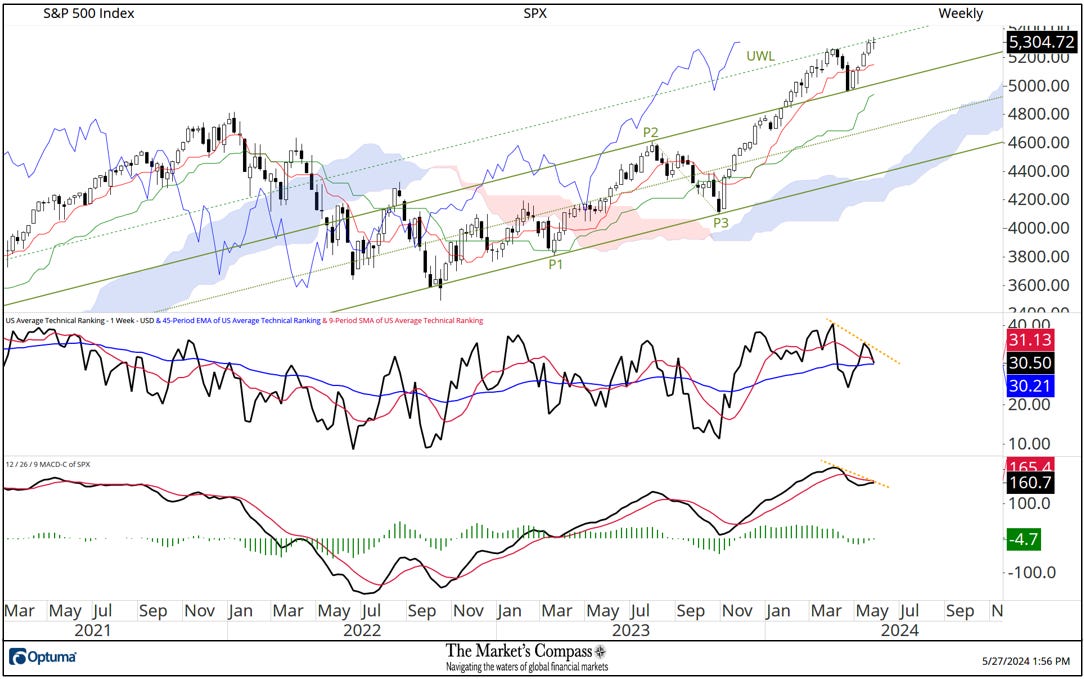
For the second time since it was first capped the price advance in late April the Upper Warning Line (green dashed line) of the Schiff Modified Pitchfork (green P1 through P3) has proven to be resistance again the past two weeks giving me confidence in my choice of that pitchfork variation. At the risk of “beating a dead horse” (with apologies, that may not be politicly correct) there are two more non-confirmation signals on the two bottom panels on the Weekly Cloud chart above. Those are; the US Average Technical Ranking (center panel) has rolled over from a lower high (that is not a surprise considering the fall in the TER discussed above) and MACD (lower panel) has not confirmed the nominal new price high (both highlighted with yellow dashed lines). Just two more potentially short-term concerning technical non-confirmation signals but it is too early to tell if this will bring the chickens home to roost but the secondary technical signals are there and should not be ignored.
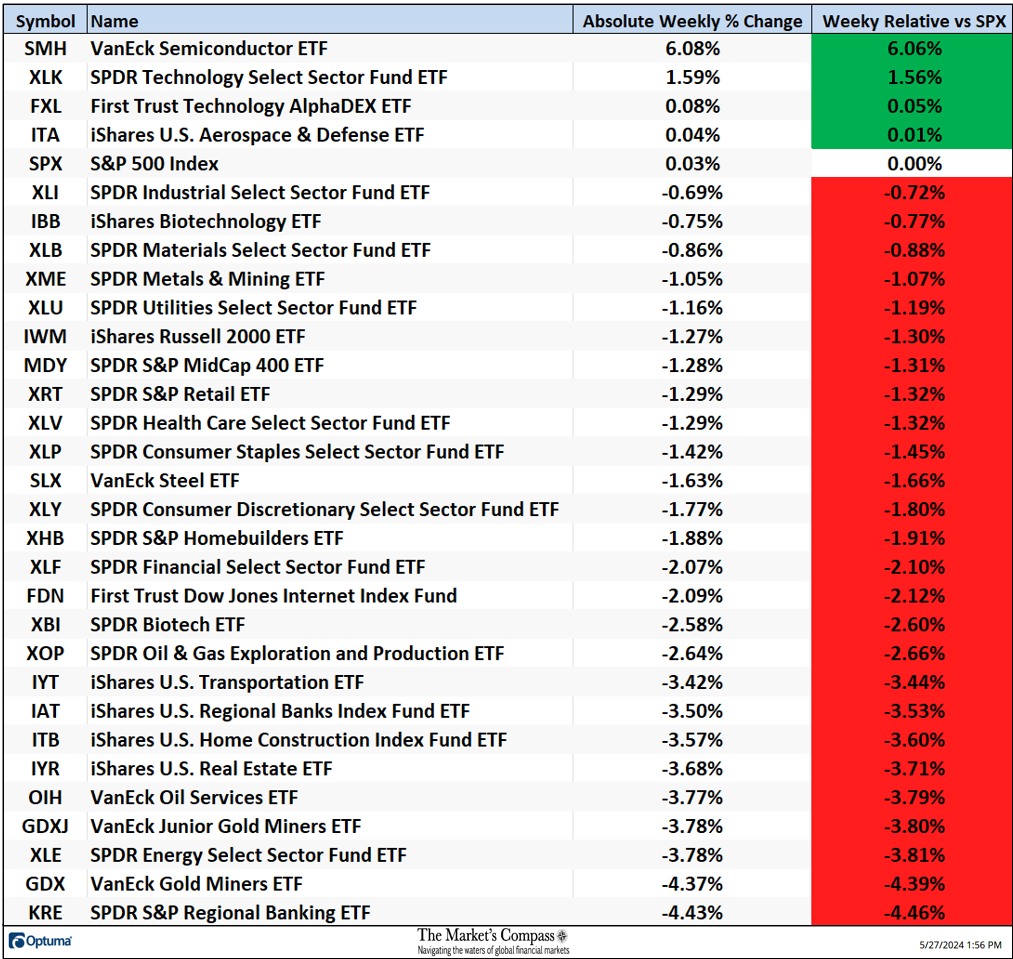
*Does not include dividends
Twenty-six of the US ETFs we track in this blog fell on an absolute basis last week and only three ETFs gained ground. The average absolute loss last week was -1.68% vs. a slight gain of +0.57% the week before and vs. a de minimis +0.03 gain in the SPX Index.
*Of interest to scalpers, traders, and technicians
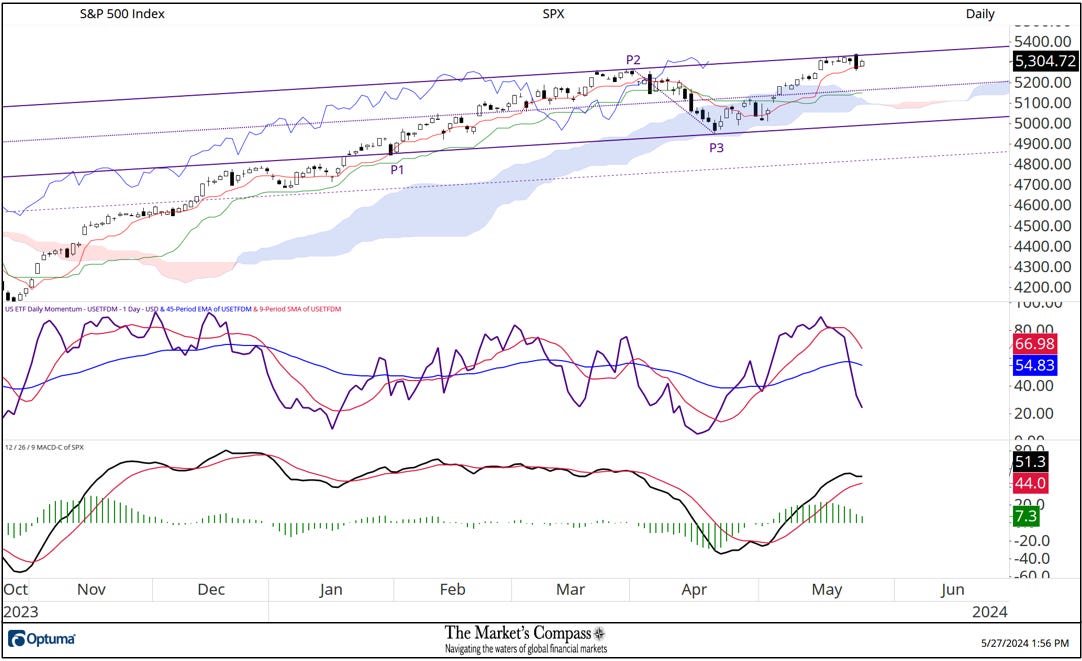
In early May when the SPX Index regained the ground above the Daily Cloud Chart, I applied a Schiff Modified Pitchfork (violet P1 through P3). Since a week ago last Wednesday prices have been capped by the Upper Parallel (solid violet line) of that pitchfork. Last Thursday the index produced a nasty outside day or in candle parlance an engulfing candle but thus far it has not unfolded into a full-fledged reversal. What has developed has been a sharp turn in my US ETF Daily Momentum / Breadth indicator which has fallen sharply despite prices holding near to the recent highs. MACD has also not confirmed the recent price highs and is beginning to roll over. I believe that odds favor a degree of backing and filling that will drive prices to key short-term support at the Median Line (violet dotted line) of the pitchfork, the Kijun Plot (green line) and the Cloud.
For readers who are unfamiliar with the technical terms or tools referred to in the comments on the technical condition of the SPX can avail themselves of a brief tutorial titled, Tools of Technical Analysis or the Three-Part Pitchfork Papers that is posted on The Markets Compass website…
https://themarketscompass.com
Charts are courtesy of Optuma.
To receive a 30-day trial of Optuma charting software go to…