



TLDR
- SOL traded near $82.50 on November 11, down 0.89% on the day.
- The price is about 34% below its late-September high near $124.
- RSI sits at 23.41, deep in oversold territory.
- US spot Solana ETFs saw about $35.1 million in outflows from November 5 to 10.
- Support is in focus at $78 to $82, with resistance near $85 and $90 to $93.
Solana (SOL) traded near $82.50 on Wednesday, November 11, down 0.89% on the day. The price has slipped since SOL broke below a major ascending trendline.
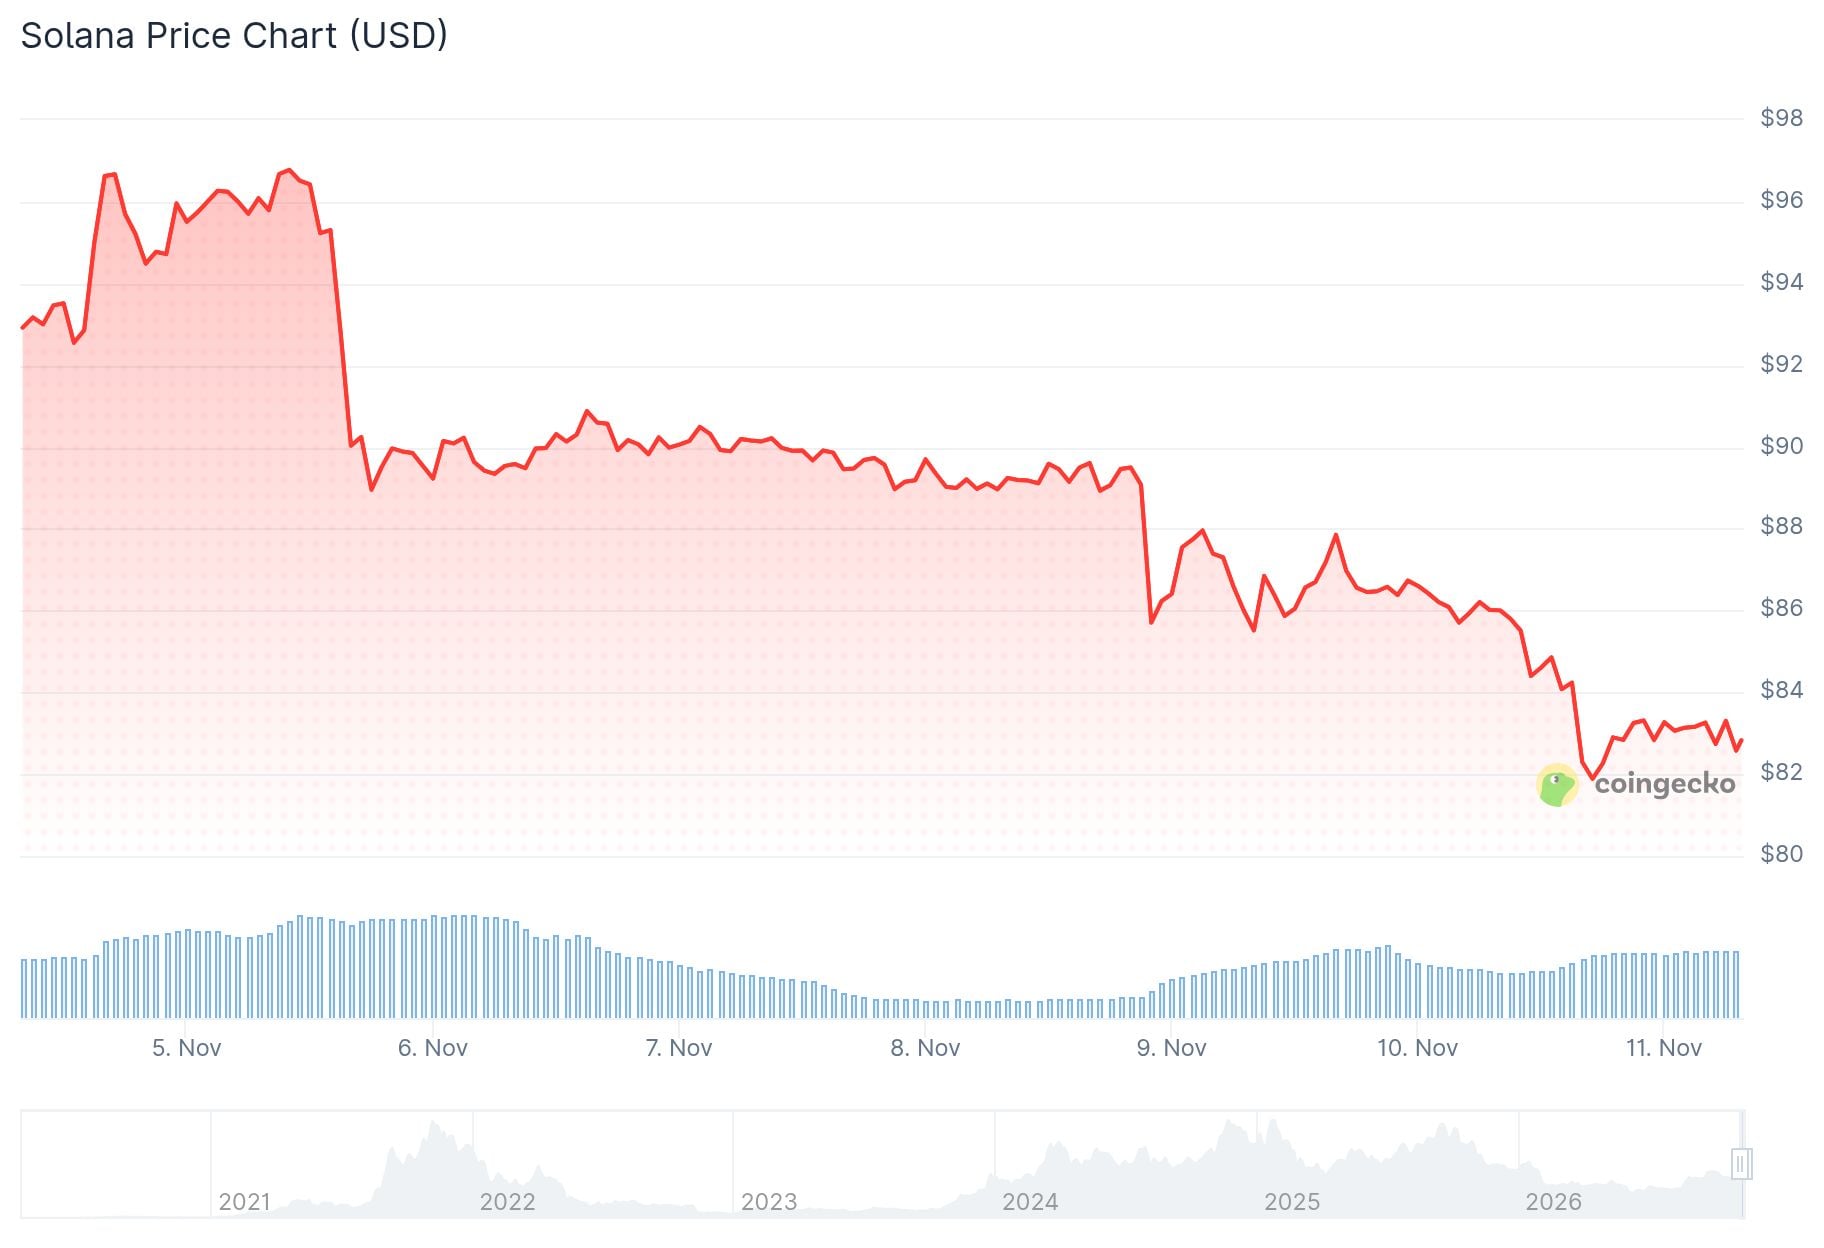
SOL is now about 34% below its late-September high near $124. Selling picked up after the rejection from the $120 to $125 area.
The Relative Strength Index (RSI) sits at 23.41, which is deep in oversold territory. Readings this low show that selling has stretched far beyond recent moves.
Analyst Jesse Olson said on X that SOL just hit all four targets he drew a month ago. He called the drop a textbook retracement after an overbought run and said price is now oversold, with a possible reversal to the upside to watch.
$SOL just hit all four targets drawn one month ago.
Text book retracement after price was overbought. Now price is oversold and we’ll see about a reversal to the upside.
Grab the popcorn. https://t.co/RooIlhxBDz pic.twitter.com/oBLVHvuAbN
— Jesse Olson (@JesseOlson) November 10, 2026
Key Price Levels on the SOL Chart
SOL built an ascending trendline after a low near $60 in June. That line held the price up through the summer, with support around $90 to $92.
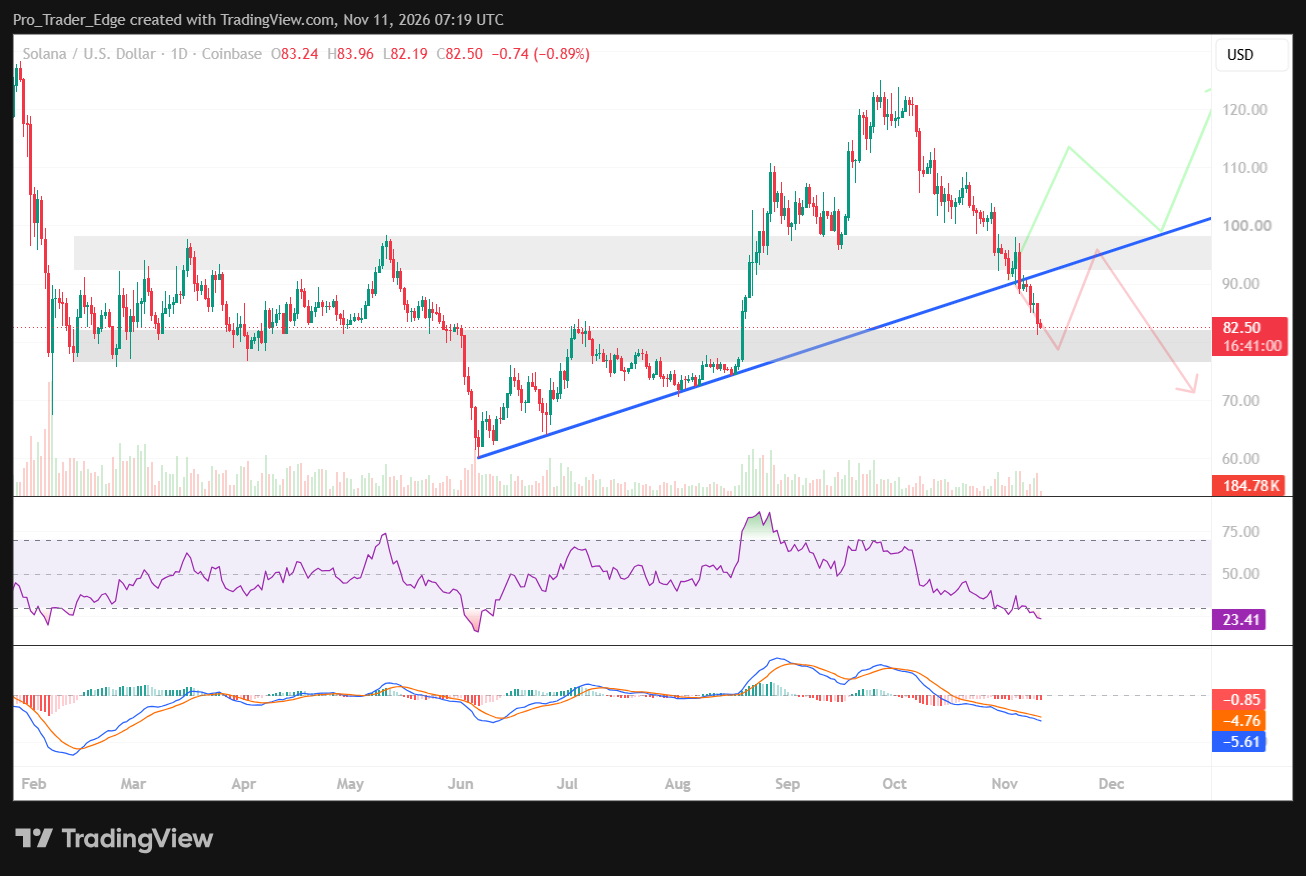
The price has now broken below that line and printed lower highs and lower lows. Wednesday’s low reached $82.19, and sellers have held control since the breakdown.

The next support zone runs from $78 to $82, where buyers stepped in during June and July. A daily close below $78 would put $70 to $75 in view.


On the upside, the first resistance is near $85. Above that, the broken trendline sits around $90 to $93, with stronger resistance between $95 and $100.
The MACD line stands at -5.61, below its signal line at -4.76. The histogram reads -0.85, and both lines remain under zero.
Traders also point to volume as a signal. A high-volume bounce from $78 to $82 would support the buyers’ case, while a breakdown on rising volume would favor sellers.
ETF Outflows and Network Data Tell Two Stories
US spot Solana ETFs recorded about $7.7 million in net outflows on November 9, according to Farside Investors. That followed $24.2 million in outflows on November 6.
The November 10 tracker first showed $2.4 million in outflows, but several funds had not yet reported. Reported withdrawals from November 5 to November 10 total about $35.1 million.
Even so, cumulative net inflows since launch remain positive at about $1.43 billion. That total has stayed above zero through the recent selling.
DefiLlama data for November 11 shows 93.48 million transactions in 24 hours. The network also had 2.71 million active addresses.
DEX volume reached $1.34 billion, and DeFi total value locked stood near $5.03 billion. Seven-day DEX volume fell 14.33% over the same period.
Stablecoin market capitalization on Solana dropped 4.36% to $14.56 billion. DefiLlama’s figures also reflect the lower prices across crypto.
BREAKING: Stablecoin Account is live in Samsung Wallet, across 82 million compatible Galaxy devices.
Buy, hold and send USDC on Solana from the same wallet Galaxy users already open for cards, boarding passes and IDs. pic.twitter.com/LMKvCAGSzs
— Solana (@solana) November 5, 2026
Samsung Wallet launched a stablecoin account on November 5. Eligible Galaxy users in the US can buy, hold, send and receive USDC on Solana.
On November 10, Helius launched Solana Privacy Rings, a permissionless privacy protocol. It adds encrypted balances, private transfers and programmable privacy features for DeFi apps.