


Welcome to The Market’s Compass Emerging Market’s Country ETF Study, Week #588. As always, it highlights the technical changes of the 20 EM Country ETFs that I track on a weekly basis and publish every third week. Paid subscribers will receive this week’s unabridged Emerging Market’s Country ETF Study sent to their registered e-mail. Past publications can be accessed by paid subscribers via The Market’s Compass Substack Blog. Next week I will be publishing The Market’s Compass Developed Markets Country ETF Study. On Sunday I published the latest edition of The Market’s Compass Crypto Sweet Sixteen Study which I publish on a weekly basis and tracks the technical changes of sixteen of the larger capitalized Cryptocurrencies.


To understand the methodology used in constructing the objective EM Country ETF Individual Technical Rankings visit the mc’s technical indicators page at www.themarketscompass.com and select “em country etfs”. What follows is a Cliff Notes version* of the full explanation of the methodology I use…
*The technical ranking system is a quantitative approach that utilizes multiple technical considerations that include but are not limited to trend, momentum, measurements of accumulation/distribution and relative strength of each individual 20 EM Country ETFs that can range between 0 and 50. The Total EM Technical Ranking or “TEMTR” is the sum of the twenty individual TRs and can be viewed as an overbought / oversold indicator as well as a confirmation / non-confirmation indicator. There is also a Total Ranking for each geographic region that can be viewed as a relative measurement on a week over week basis.
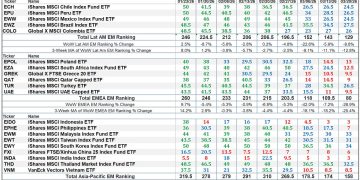
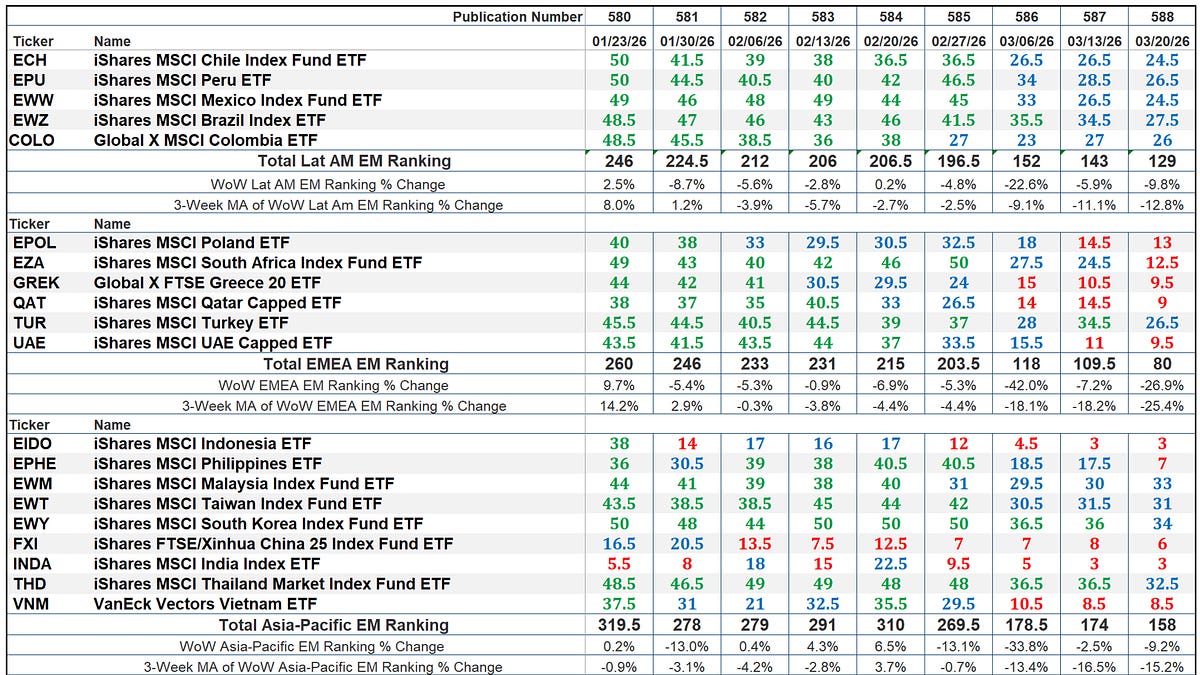
This past week The Total EM Technical Ranking or “TEMTR” fell -13.95% to 367 from 426.5 the previous week which was a continued drop from 448.5 reading three weeks ago which was a 33.01% drop from the week ending 2/27 (669.5). Not surprisingly the Total EMEA EM Ranking fell most of the three geographic regions last week, -26.9% to 80 from 109.5 two weeks ago. Since the week ending 2/27 the Total EMEA EM Ranking (196.6) has fallen 60.68%. Last week the Total Asia-Pacific Ranking fell-9.2% to 158 from 174 the week before and has fallen the most since the week ending 2/27 down 41.37%. The Total Lat AM EM Ranking fell -9.8% to 129 from 143 the previous week. Since the week ending 2/27, the Total Lat/AM EM Ranking has fallen the least of the three geographic regions down 34.35%.
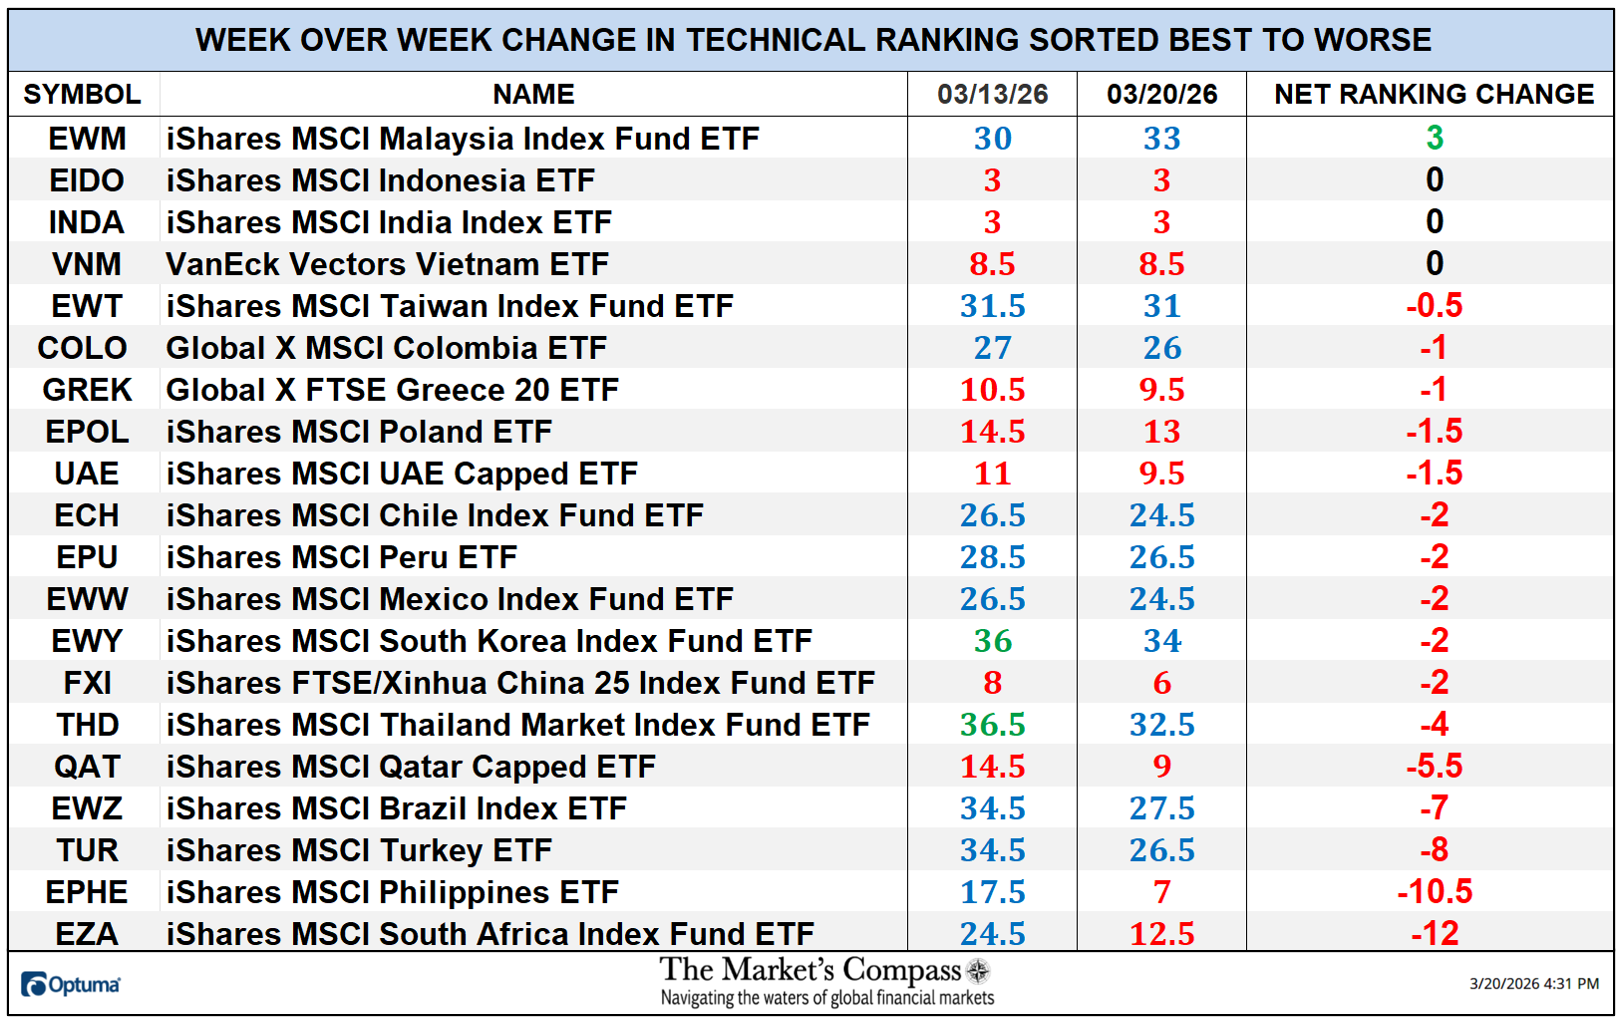
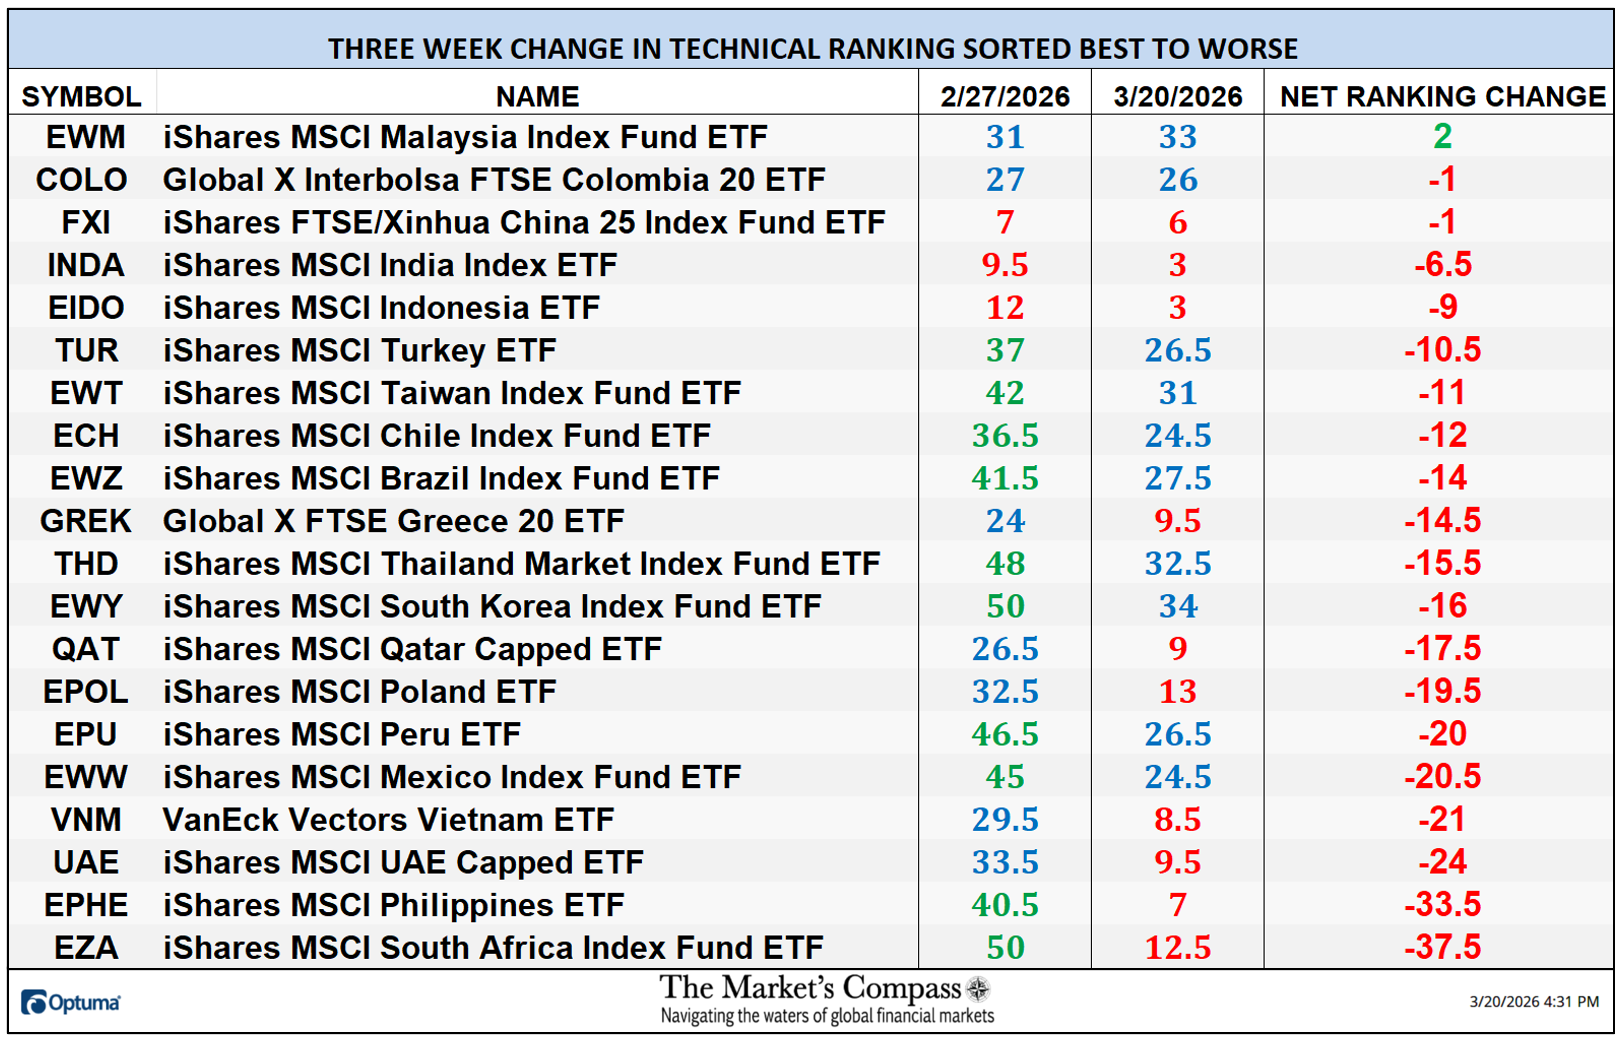
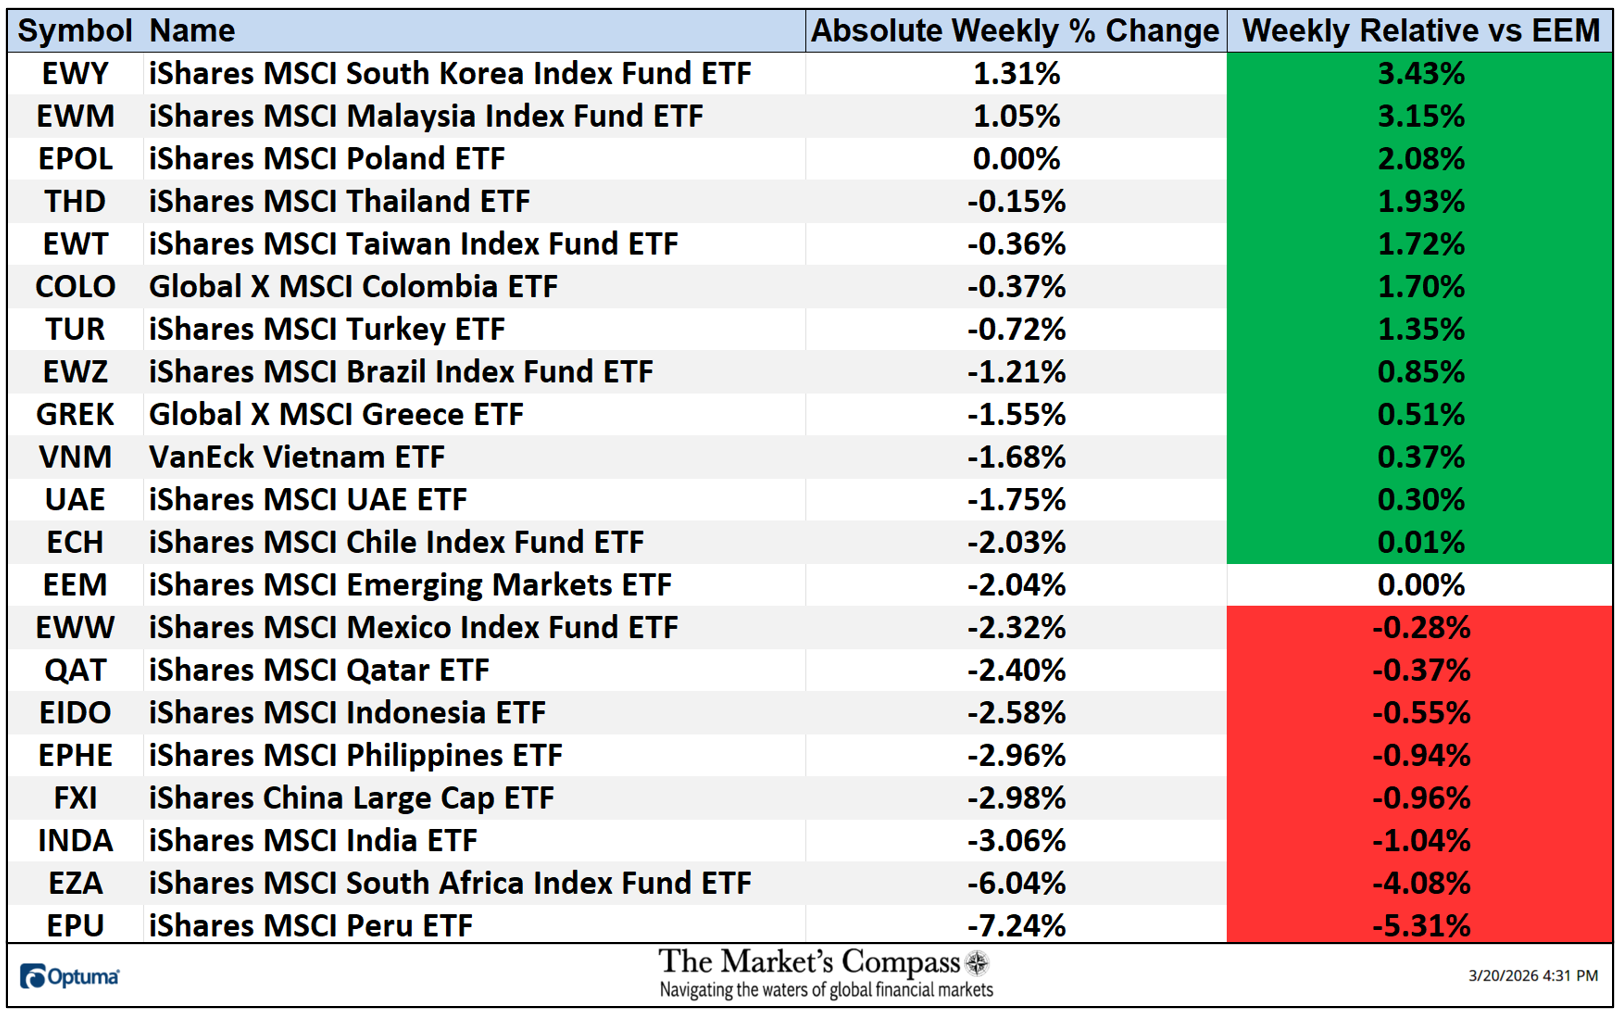
Only one of the twenty EM Country ETFs I track in these pages registered a gain in their Technical Rankings or TRs over the past week; three were unchanged and twelve had TRs that fell, of which two fell double digits (the iShares MSCI Philippines ETF (EPHE) and the iShares South Africa Index Fund ETF (EZA). Last week none of the TRs were in the “green zone” (TRs between 34.5 and 50), ten were in the “blue zone” (TRs between 15.5 and 34), and ten were in the “red zone” (TRs between 0 and 15). The previous week two TRs were in the “green zone”, ten were in the “blue zone”, and eight were in the “red zone”. For two weeks running all five Lat/Am TRs remained in the “blue zone”. The panel below reflects the technical deterioration of EM Country ETFs and the degradation in individual Technical Rankings since the week ending February 27th.
*To understand the construction the of The Technical Condition Factors visit the Market’s Compass website www.themarketscompass.com and go to the mc’s technical indicators page and select “em country etfs”.
A short version of the how the Technical Condition Factors are calculated follows…
There are eight Technical Condition Factors (“TCFs”) that are a summation of the twenty ETFs TRs technical condition of each TCF question. The eight Technical Condition Factors do not ask the same number of questions. That is why it is calculated as a percentage. If a TCF individual reading is 100% that would mean that all Twenty ETFs fullfilled that particular TCF criterior.

Falling back into oversold territory this past week a reading 10.00% was registered in the Daily Momentum Technical Condition Factor (”DMTCF”) or 14 out of a possible total of 140 positive points.
As a confirmation tool, if all eight TCFs improve on a week-over-week basis, more of the 20 ETFs are improving internally on a technical basis, confirming a broader market move higher (think of an advance/decline calculation). Conversely if all eight TCFs fall on a week-over-week basis it confirms a broader market move lower. Last week, seven TCFs fell, and one was unchanged confirming the continued technical weakness.
The Relative Rotation Graph, commonly referred to as RRGs were developed in 2004-2005 by Julius de Kempenaer. These charts are a unique visualization tool for relative strength analysis. Chartists can use RRGs to analyze the relative strength trends of several securities against a common benchmark, (in this case the EEM) and against each other over any given time period (in the case below, daily) over the past three weeks. The power of RRG is its ability to plot relative performance on one graph and show true rotation. All RRGs charts use four quadrants to define the four phases of a relative trend. The Optuma RRG charts uses, From Leading (in green) to Weakening (in yellow) to Lagging (in pink) to Improving (in blue) and back to Leading (in green). True rotations can be seen as securities move from one quadrant to the other over time. This is only a brief explanation of how to interpret RRG charts. To learn more, see the post scripts and links at the end of this Blog.
Not all 20 ETFs are plotted in this RRG Chart. I have done this for clarity purposes. Those which I believe are of higher technical interest remain.
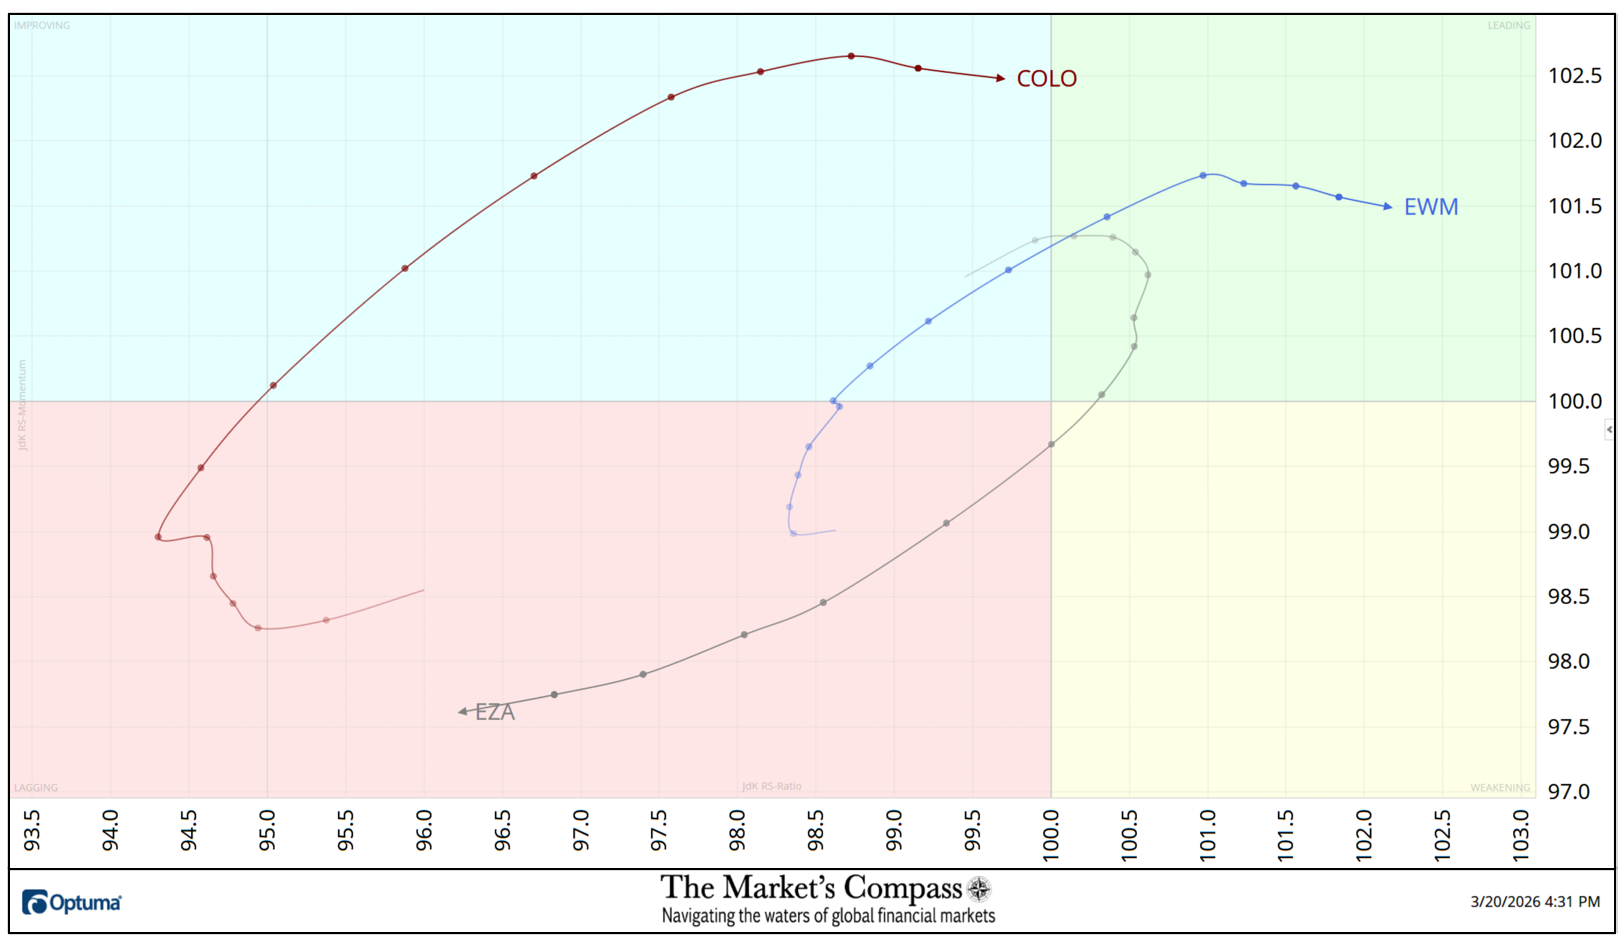
The iShares MSCI Malaysia Index Fund ETF (EWM) has made what I often refer to as a “positive three quadrant move” over the past three weeks by rising out of the Lagging Quadrant, through the Improving Quadrant, with a pickup in Relative Strength Momentum, and into the Leading Quadrant ending last week registering the best Relative Ratio at 102.16 vs. the iShares Emerging Markets ETF or EEM, of the twenty ETFs we track in these pages (see the Tabulation Table below). That said, Relative Strength Momentum has begun to slow slightly. After rolling over in the Leading Quadrant three weeks ago, the iShares MSCI South Africa Index Fund ETF (EZA) fell briefly into the Weakening Quadrant a week ago last Thursday. Increasing negative Relative Strength Momentum (note the distance between the daily nodes) quickly drove the EZA into the Lagging Quadrant and lower. A week ago, last Wednesday, The Global X MSCI Colombia ETF (COLO) escaped the Lagging Quadrant rising into the Improving Quadrant exhibiting strong Relative Strength Momentum vs. the EEM and is only one “good” day from entering the Leading Quadrant.
The “Tabulation Table” below marks the Relative Strength and Relative Strength Momentum readings vs. the iShares MSCI Emerging Markets Index ETF or EEM. It begins with the readings at the end of last week followed by the trailing three weeks that includes the readings from the last Study for the week ending 1/16. If there has been an improvement in either the Relative Strength Ratio or the Relative Strength Momentum reading on a week-over-week basis I have highlighted it in green. If there has been a contraction in either, it is highlighted in red and an unchanged reading in either will remain black. The color-coding system serves as a heat map over the past four Friday’s readings highlighting either the continued improvement, deterioration, or stasis vs. the benchmark, the EEM. The ETFs that are displayed on the RRG chart above are highlighted in blue.
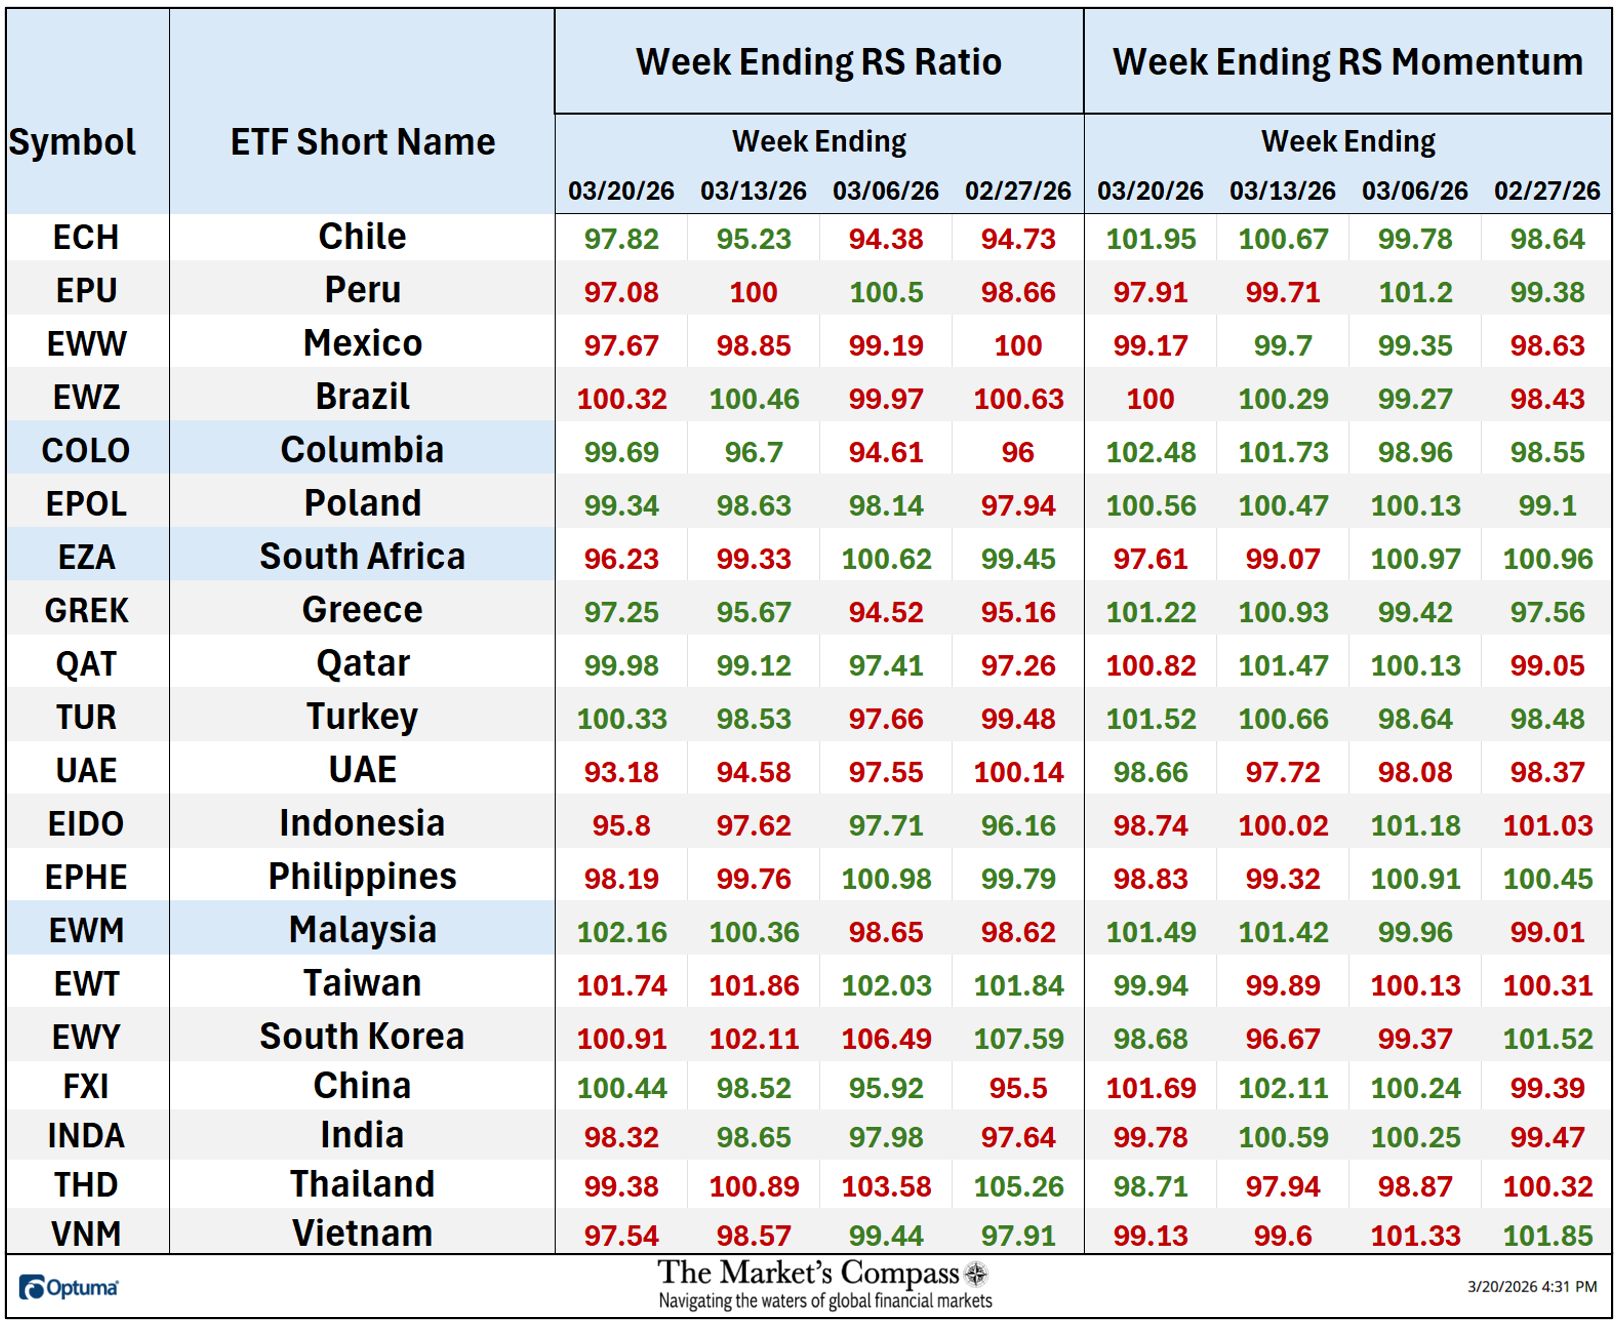
*The “TEMTR” is the sum of the 20 Individual Objective EM ETF Technical Rankings. It serves as an overbought or oversold as well as a confirmation / non-confirmation indicator.
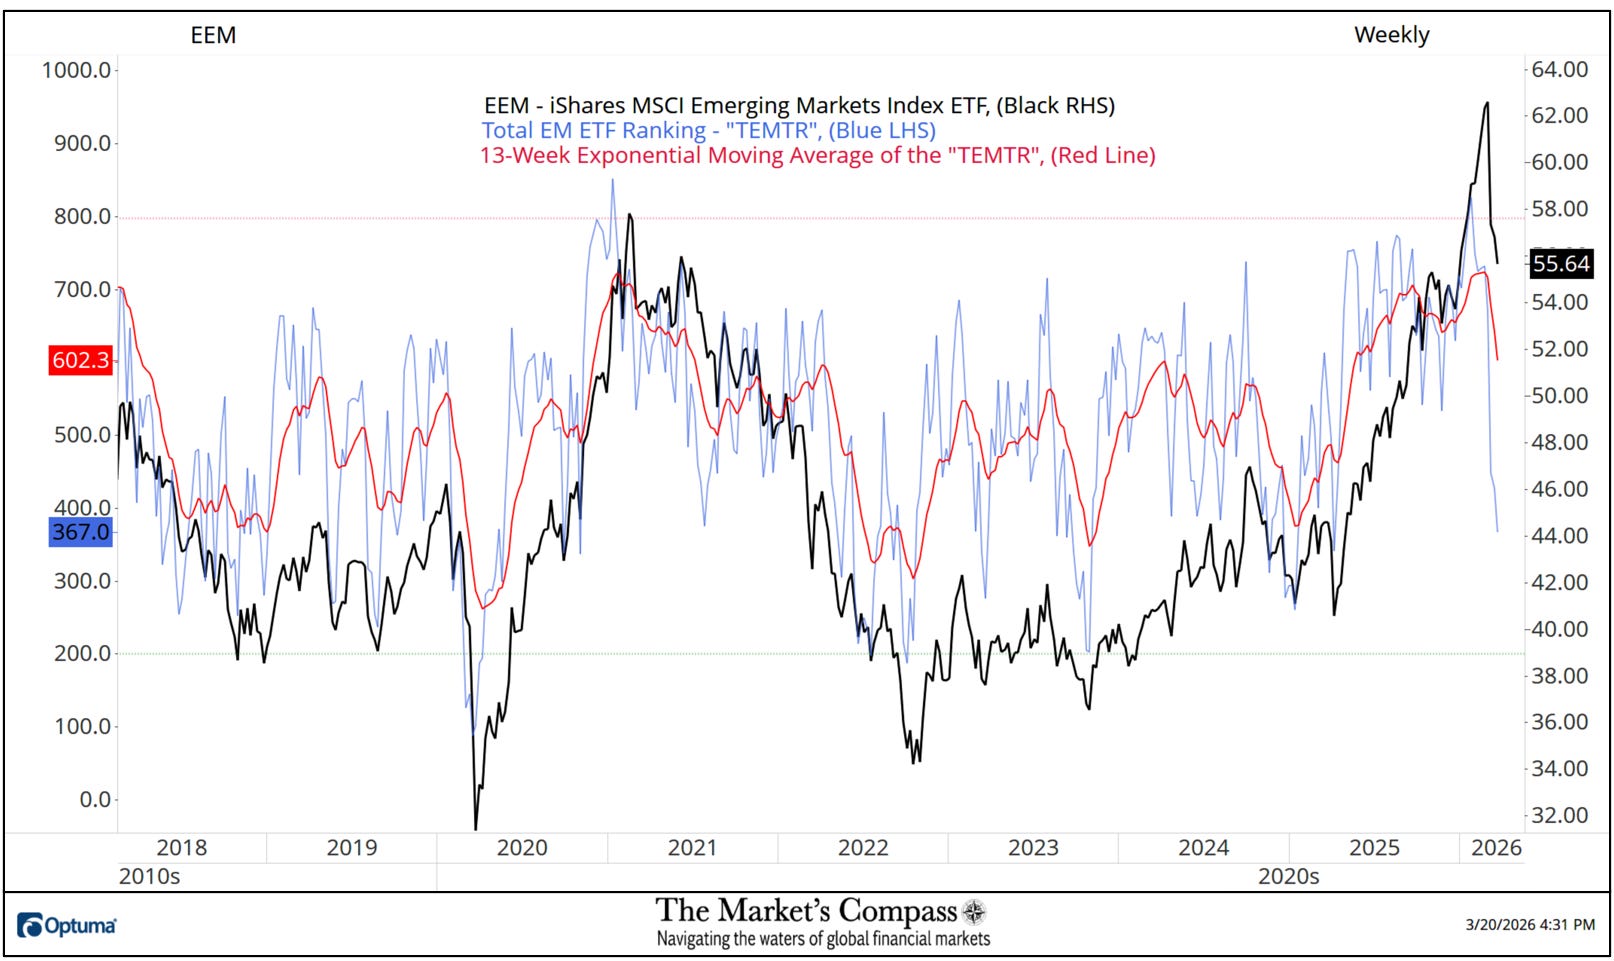
The sub-title of the last EM Country ETF Study published for the week ending February 27th was “IMO Somethings Gotta Give” but over the following weekend the United States and Israel launched coordinated airstrikes on Iran. Although the technical reasons for that secondary title can be seen looking back on the chart above when the Total EM ETF Ranking or TEMTR fell below the 13-Week Exponential Moving average (red line) to a sub-700 reading while EEM rose to a new Weekly closing high but it is needless to say the geopolitical consequences greatly superseded that initial technical concern. More on the longer-term technical repercussions from recent events follow on the shorter-term Weekly Chart.
*The “ATR” like the “TEMTR” serves as an overbought or oversold as well as a confirmation / non-confirmation indicator.
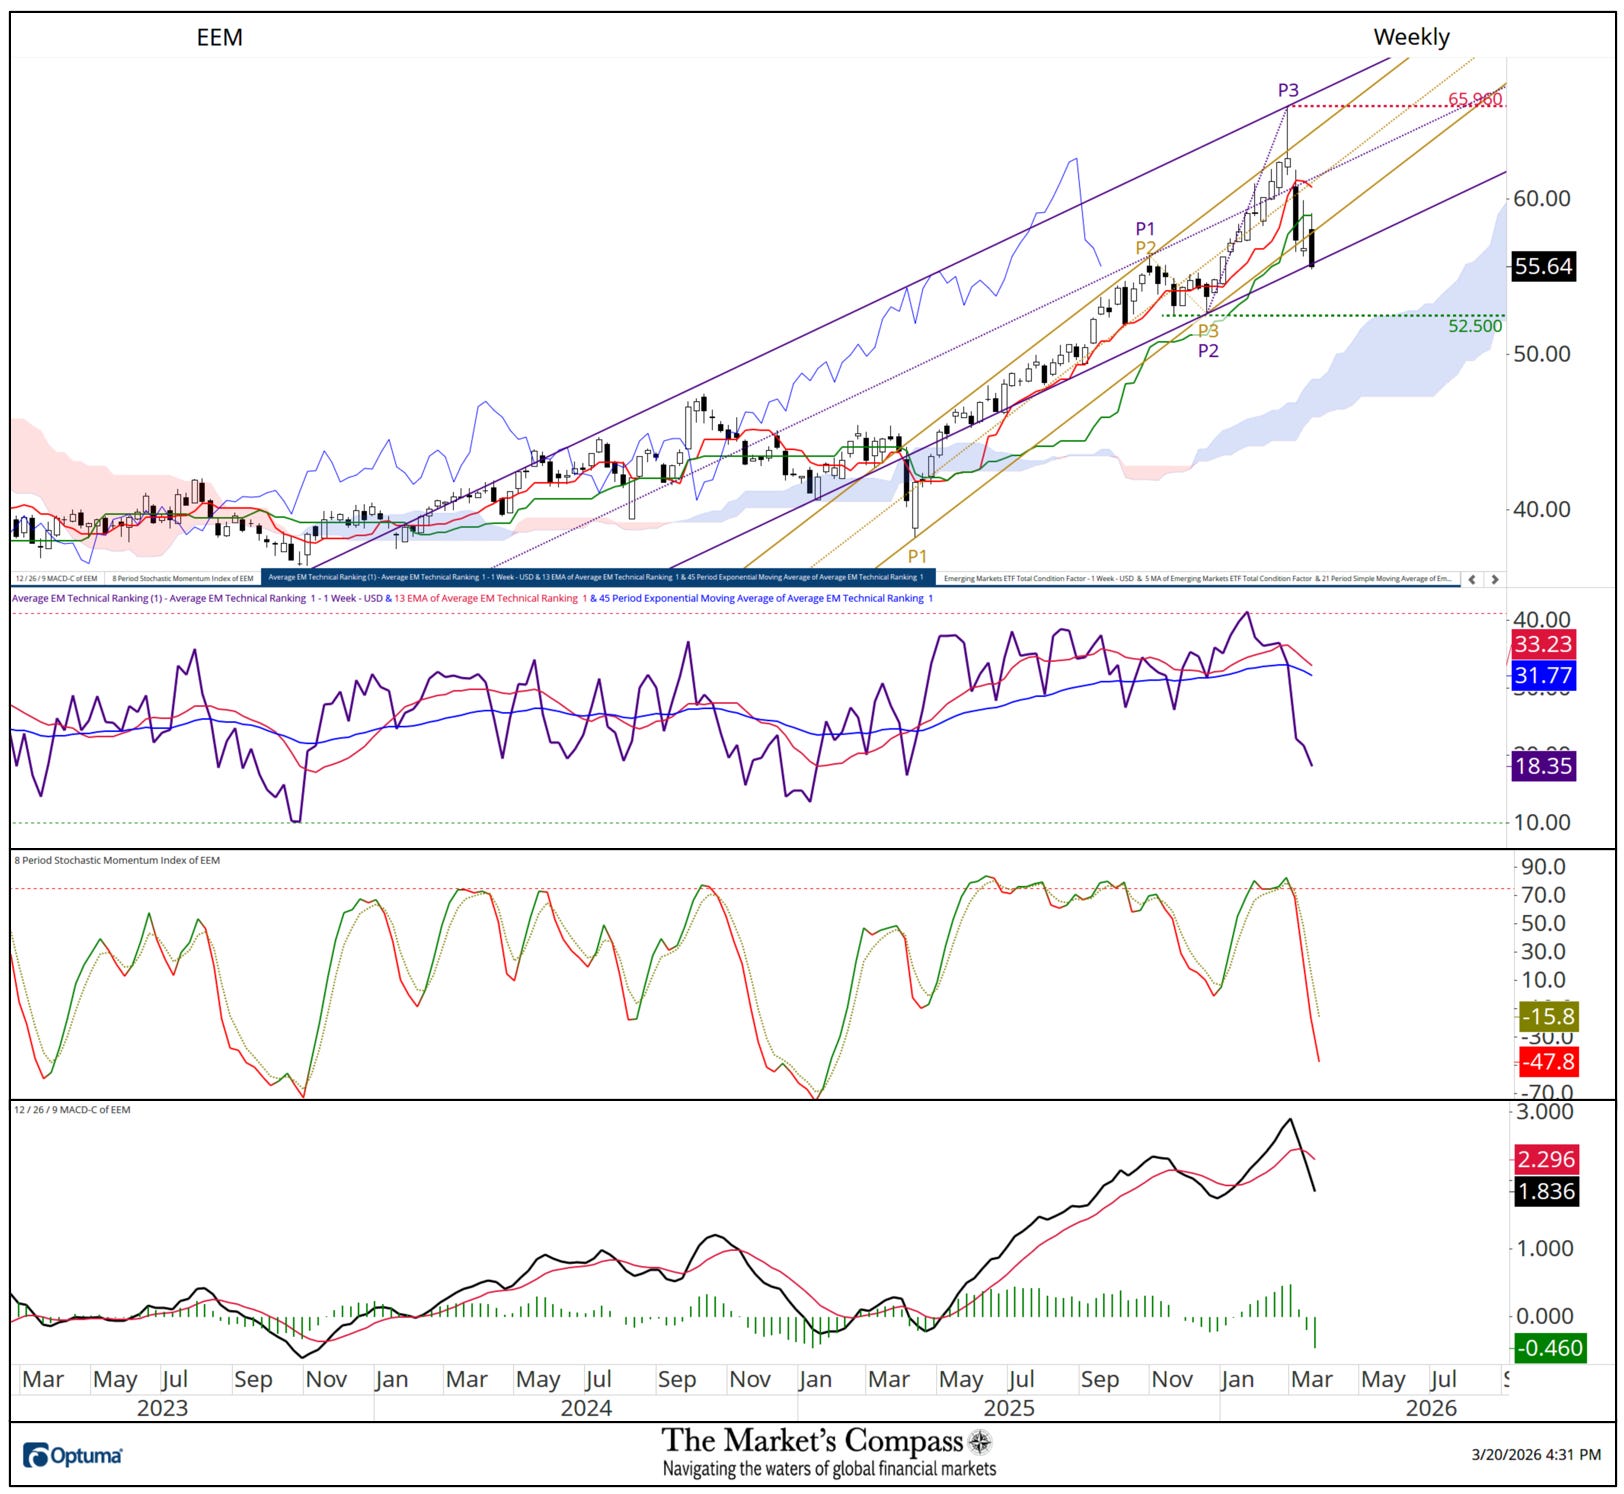
Two weeks ago, the EEM fell below support at the Lower Parallel (solid gold line) of the Schiff Modified Pitchfork (gold P1-P3) and despite a valiant attempt to recover the lost ground above the Lower Parallel by the end of the week the EEM closed back below it. A second attempt to rally last week failed at resistance at the Kijun Plot (green line) and at the week’s close the EEM was teetering on support afforded by support at the Lower Parallel (solid violet line) at the newly drawn Standard Pitchfork (violet P1 through P3). At the end of the week the Average EM Technical Ranking has fallen to the lowest level since April of last year, breaking below both the longer-term and shorter-term moving average of the oscillator. Both the Stochastic Momentum Index and MACD had reached overbought territory and now reflect the sharp loss of any positive price momentum in addition to showing no signs of downtrend exhaustion in either oscillator.
Learn about Pitchforks and their application in the three-part Pitchfork tutorial at the Market’s Compass website, www.themarketscompass.com
More on the technical condition of the EEM in Thoughts on the Short-Term Technical Condition of the EEM but first…
*Does not include dividends if any.
Only two of the twenty EM Country ETFs were up on an absolute basis last week (the iShares MSCI Poland ETF (EPOL) was unchanged) and seventeen traded lower over the week. Twelve of the EM ETFs outperformed the -2.04% loss in the EEM on a relative basis and eight underperformed. The average five-day absolute loss in the Emerging Markets ETFs was -1.89%, adding to the -1.75% loss the previous week and the sharp -8.44% loss three weeks ago.
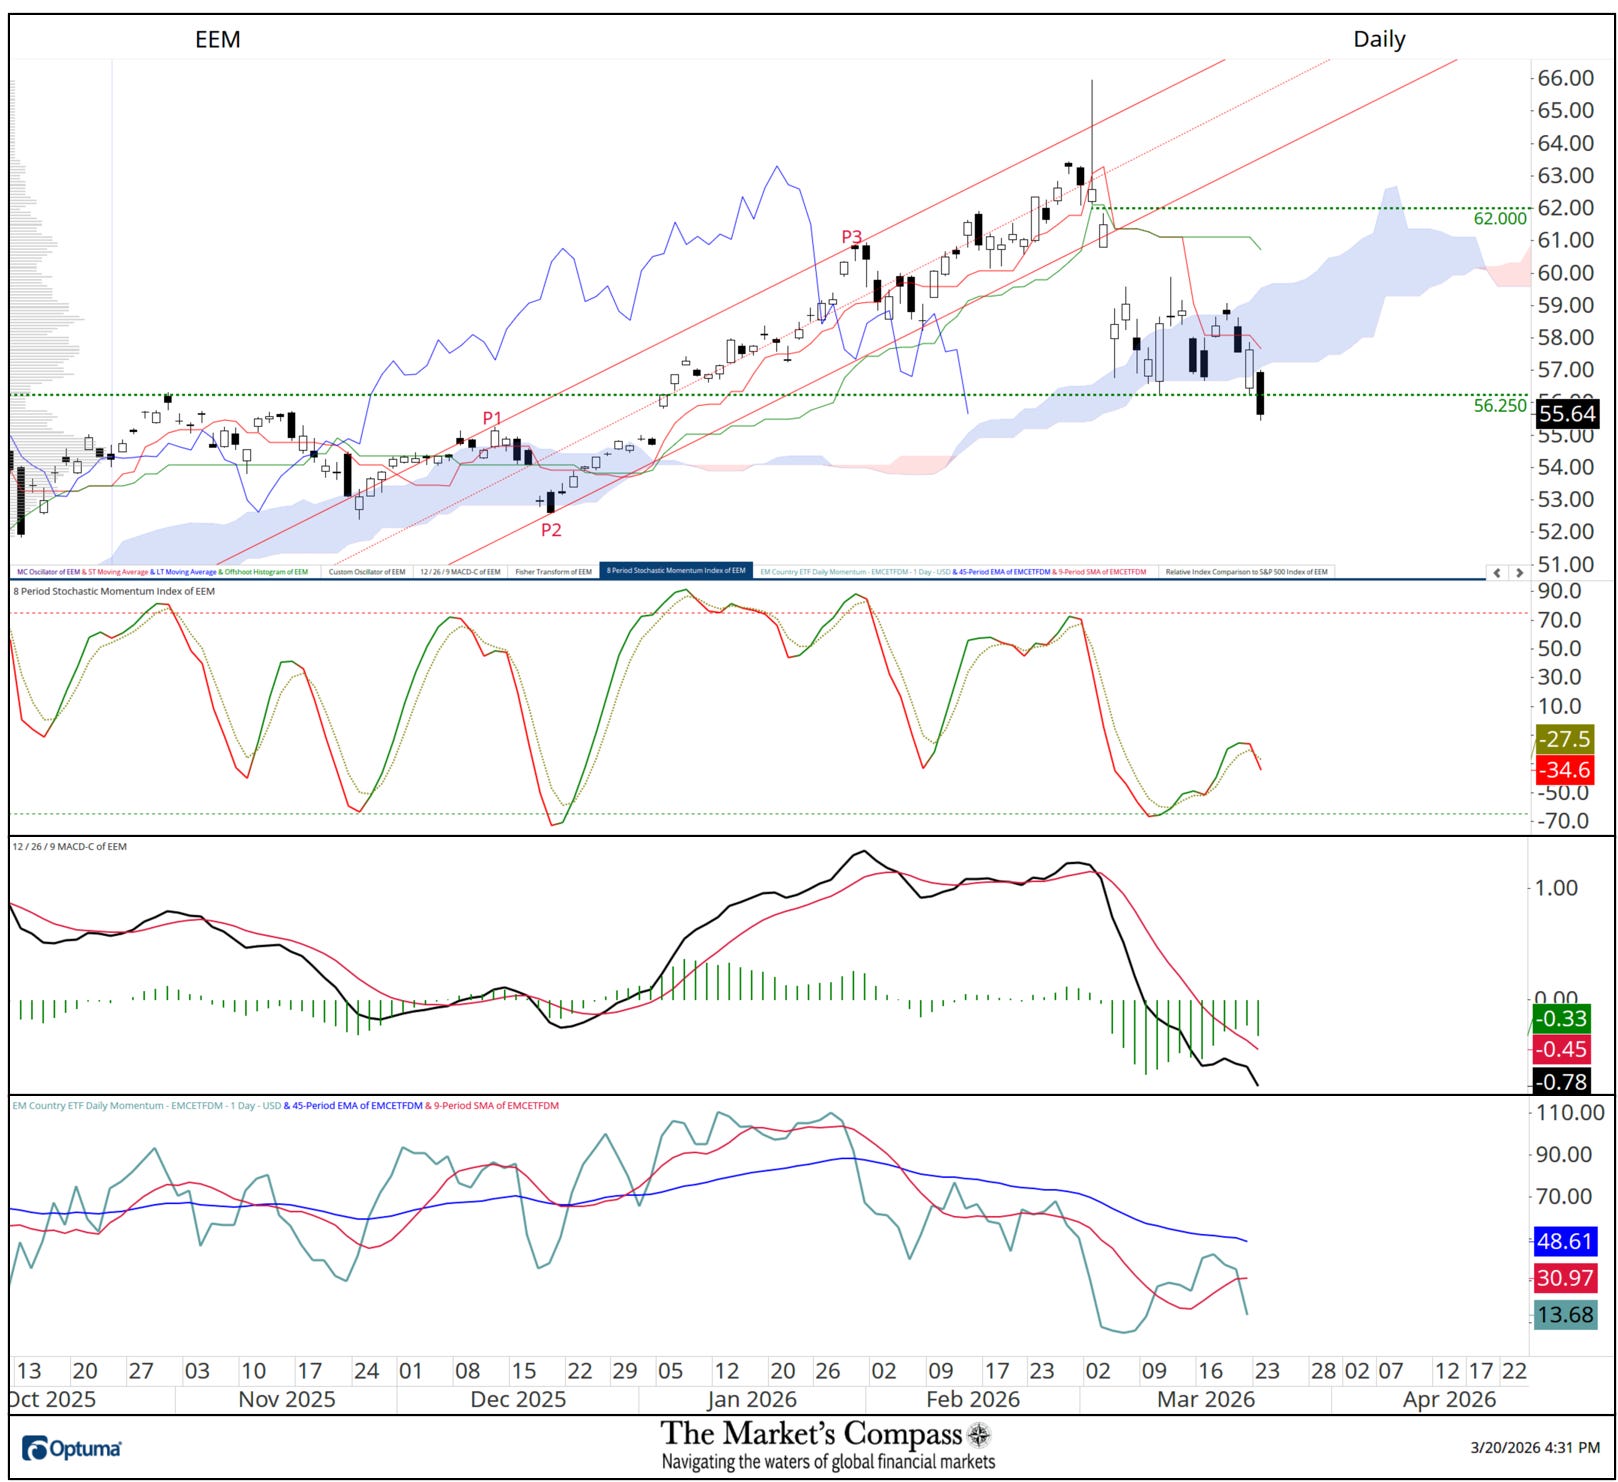
There is nothing that can be said to be even faintly technically positive about the current state of the EEM. Prices broke key support on Friday at 56.25 and all three momentum oscillators are tracking lower. This week’s subtitle “Don’t Clean Off the Fan Blades Yet, There is More to Come! sums it all up. I will post an update next week if there are notable technical changes.
All the charts are courtesy of Optuma whose charting software enables anyone to visualize any data including my Objective Technical Rankings. The following links are an introduction and an in-depth tutorial on RRG Charts…
https://www.optuma.com/videos/introduction-to-rrg/
https://www.optuma.com/videos/optuma-webinar-2-rrgs/
To receive a 30-day trial of Optuma charting software go to…