


Welcome to this week’s publication of the Market’s Compass Crypto Sweet Sixteen Study #186. The Study tracks the technical condition of sixteen of the larger market cap cryptocurrencies. Every week the Studies will highlight the technical changes of the 16 cryptocurrencies that I track as well as highlights on noteworthy moves in individual Cryptocurrencies and Indexes. As always, paid subscribers will receive this week’s unabridged Market’s Compass Crypto Sweet Sixteen Study sent to their registered email. In celebration of the Easter Holiday, free subscribers will also receive the full version (in a thinly veiled attempt to lure them into becoming paid subscribers). Past publications including the Weekly ETF Studies can be accessed by paid subscribers via The Market’s Compass Substack Blog.
An explanation of my objective Individual Technical Rankings go to www.themarketscompass.com. Then go to the MC’s Technical Indicators and select “crypto sweet 16”. What follows is a Cliff Notes version of the full explanation…
”The technical ranking system is a quantitative approach that utilizes multiple technical considerations that include but are not limited to trend, momentum, measurements of accumulation/distribution and relative strength. The TR of each individual Cryptocurrency can range from 0 to 50”.
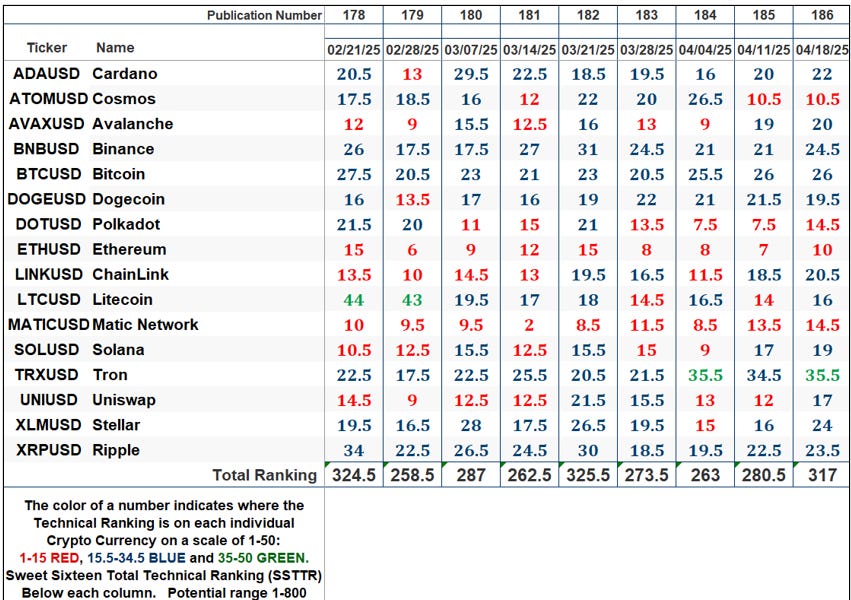
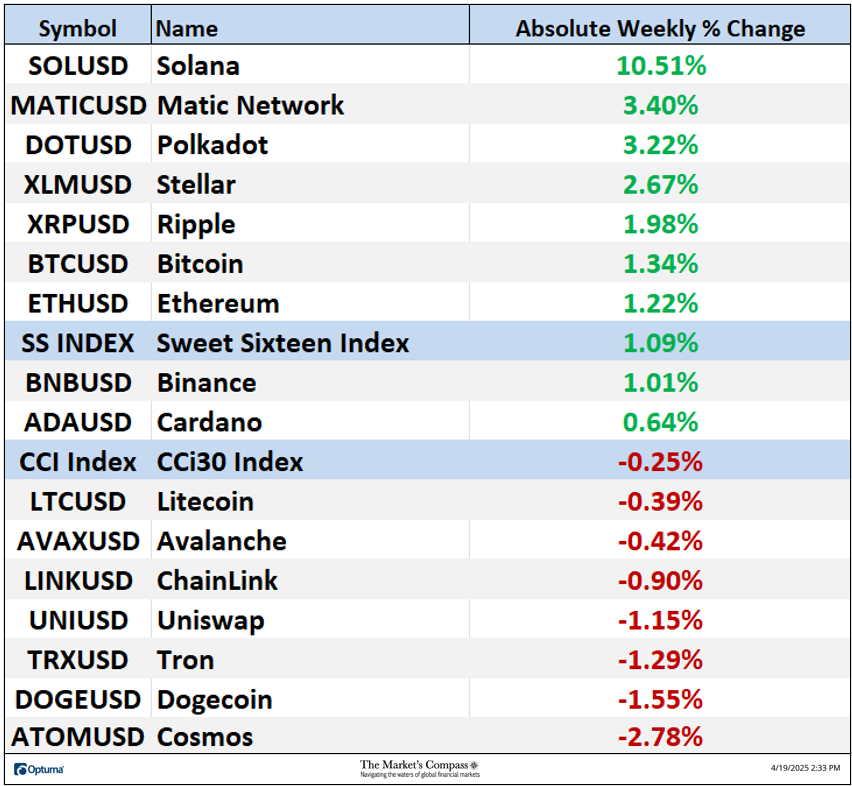
The Excel spreadsheet below indicates the weekly change in the objective Technical Ranking (“TR”) of each individual Cryptocurrency and the Sweet Sixteen Total Technical Ranking (“SSTTR”).
*Rankings are calculated up to the week ending Friday April 18th
The Sweet Sixteen Total Technical Ranking or “SSTTR” rose +13.01% to 317 from the previous week’s reading of 280.5 which was up 6.63% from the week before reading of 263. For the past ten weeks the SSTTR has ranged between 258 and 330 as it continues to track sideways.
The long period of stasis in the SSTTR that I referred to above is mirrored by the de minimis WoW change in Individual TRs aside from Stellar (XLM) and Polkadot (DOT). Last week, thirteen of the Crypto Sweet Sixteen TRs rose, two were unchanged, and one fell. The average Crypto TR gain last week was +2.28, vs. the previous week’s average TR gain of +1.09. Only one of the sixteen crypto currencies TRs I track ended the week in the “green zone” (TRs between 35 and 50) and that was Tron (TRX), eleven TRs were in the “blue zone” (TRs between 15.5 and 34.5), and four were in the “red zone”. That was a slight improvement versus the previous week when, ten were in the “blue zone”, and six were in the “red zone”.
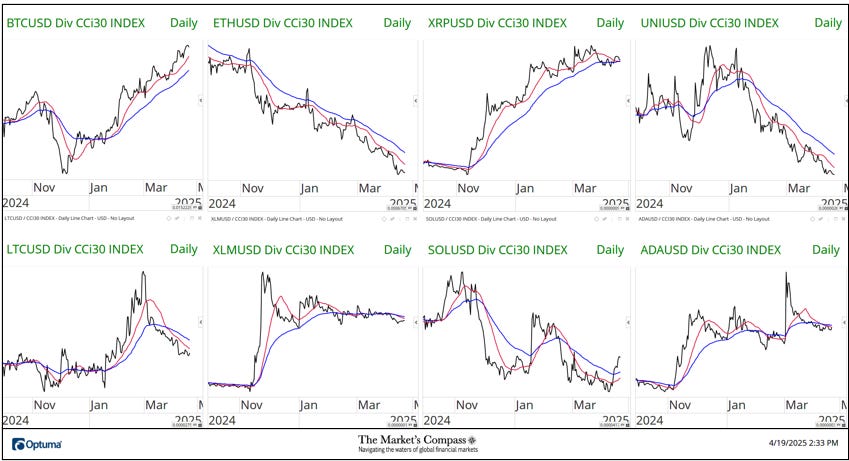
*The CCi30 Index is a registered trademark and was created and is maintained by an independent team of mathematicians, quants and fund managers lead by Igor Rivin. It is a rules-based index designed to objectively measure the overall growth, daily and long-term movement of the blockchain sector. It does so by indexing the 30 largest cryptocurrencies by market capitalization, excluding stable coins (more details can be found at CCi30.com).
A brief explanation of how to interpret RRG charts can be found at The Market’s Compass website www.themarketscompass.com Then go to MC’s Technical Indicators and select Crypto Sweet 16. To learn more detailed interpretations, see the postscripts and links at the end of this Blog.
The chart below has two weeks, or 14 days, of data points deliniated by the dots or nodes. Not all 16 Crypto Currencies are plotted in this RRG Chart. I have done this for clarity purposes. Those which I believe are of higher technical interest remain.
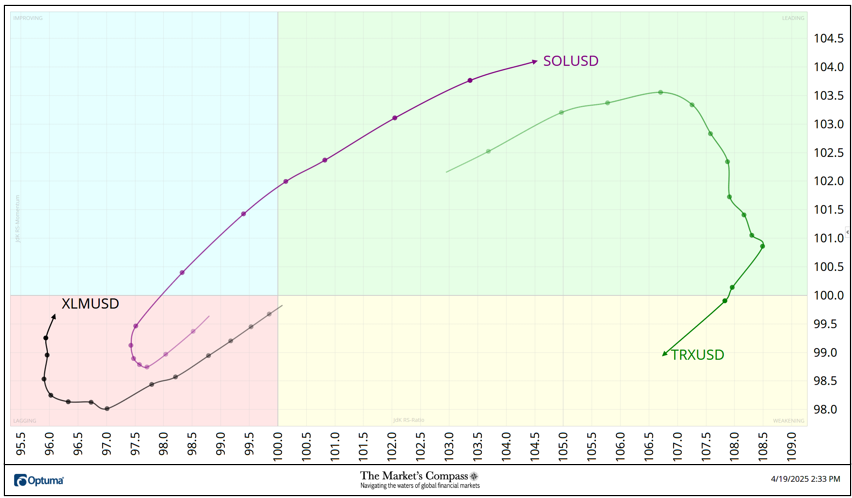
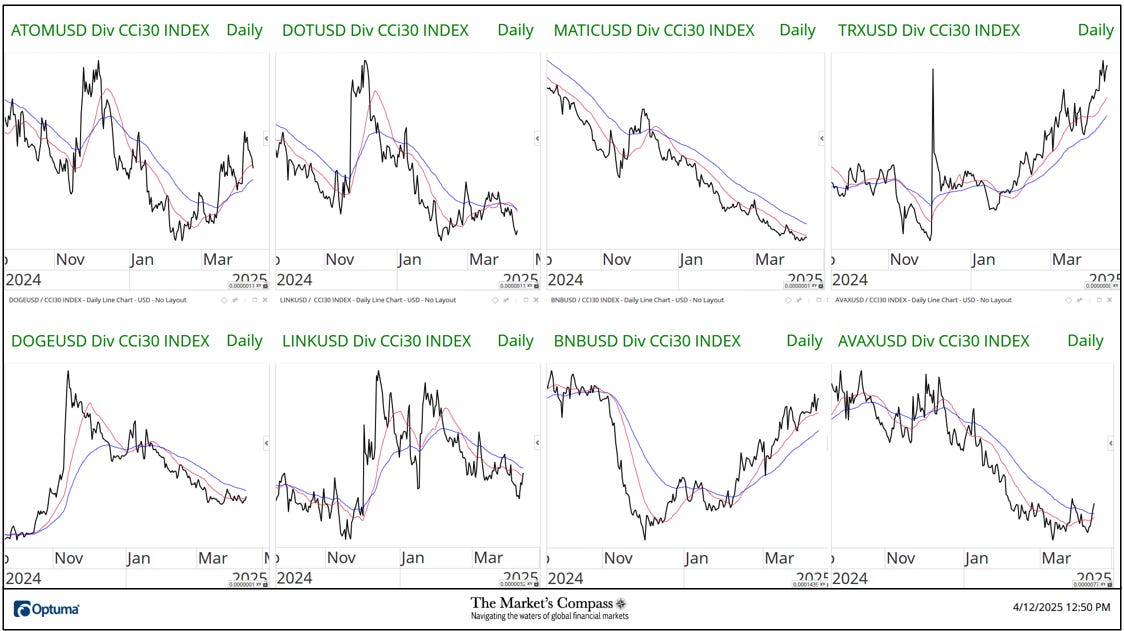
In last week’s discussion of the Relative Strength and Relative Strength Momentum (or lack of it) I brought attention to Tron which was rolling over and was losing Relative Strength Momentum in the Leading Quadrant. That continued into the latter half of last week, losing Relative Strength as well vs. the CCi30 Index. as it dropped into the Weakening Quadrant. Solana (SOL) hooked higher two weeks ago and gathered a pace higher through the Improving Quadrant and into the Leading Quadrant last week displaying superior Relative Strength Momentum and Relative Strength. Stellar continues to struggle in the Lagging Quadrant but it turned high last week and is on course to enter the Improving Quadrant.
The two panels below contain longer term line charts of the Relative Strength or Weakness of the Sweet Sixteen Crypto Currencies vs. the CCi30 Index that are charted with a 55-Day Exponential Moving Average in blue and a 21-Day Simple Moving Average in red. Trend direction and crossovers, above or below the longer-term moving average, reveals potential continuation of trend or reversals in Relative Strength or Weakness.
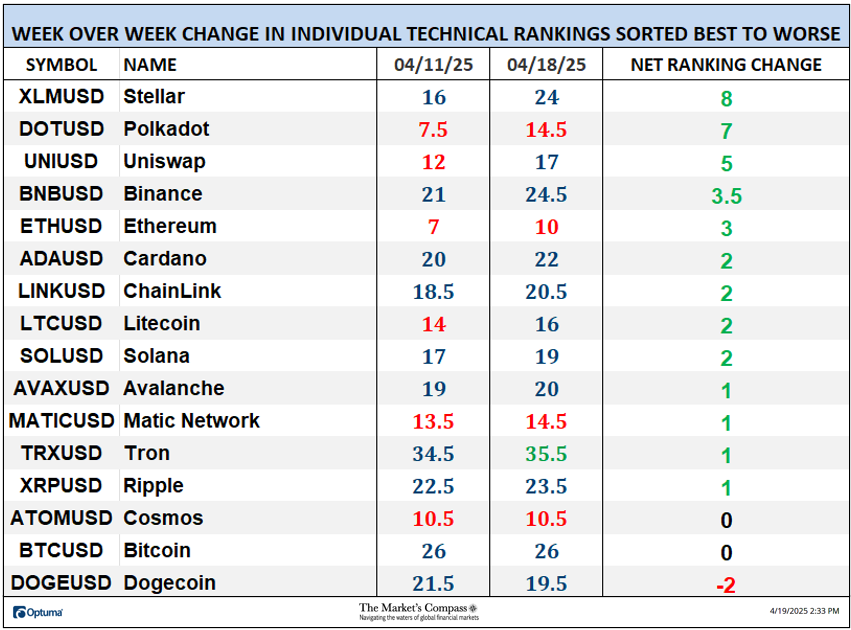
*Friday April 11th to Friday April 18th.
Nine of the Sweet Sixteen gained absolute ground over the seven-day period ending Friday and seven fell. The seven-day average absolute price gain was 1.09%, reversing the previous week’s average absolute loss of -5.75% when only two gained absolute ground over the seven-day period ending the previous Friday and fourteen fell on an absolute basis. If it was not for Solana’s (SOL) outsized absolute gain last week, the average absolute gain would have been +0.47%
*An explanation of my Technical Condition Factors go to www.themarketscompass.com. Then go to the MC’s Technical Indicators and select Crypto Sweet 16.
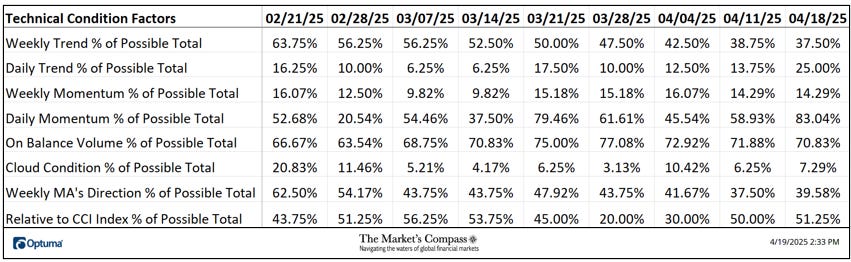
The DMTCF rose last week from a reading of 58.93% or 66 the week before to 83.04% or 93 out of a possible 112.
As a confirmation tool, if all eight TCFs improve on a week over week basis, more of the 16 Cryptocurrencies are improving internally on a technical basis, confirming a broader market move higher (think of an advance/decline calculation). Conversely, if more of the TCFs fall on a week over week basis, more of the “Cryptos” are deteriorating on a technical basis confirming the broader market move lower. Last week five TCFs rose nominally (aside from the jump in the DMTCF), one was unchanged and two fell.
For a brief explanation on how to interpret the Sweet Sixteen Total Technical Ranking or “SSTTR” vs the weekly price chart of the CCi30 Index go to www.themarketscompass.com. Then go to the MC’s Technical Indicators and select Crypto Sweet 16.
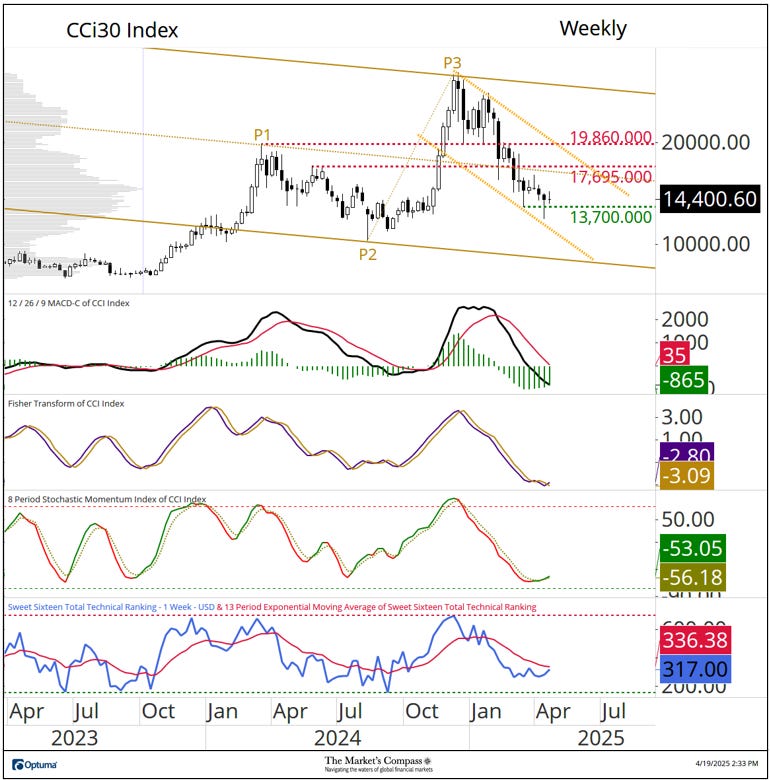
Last week prices moved very little but did manage to hold above key price support at the 13,700 level and remain in the confines of the price channel (yellow dashed lines). The shorter-term Stochastic Momentum Index is “trying to turn higher from oversold territory but I would be hard pressed to declare it as technically significant. The spread between MACD and its signal line is closing but the oscillator continues to track lower. Both technical features lack a directional clue. Only a rally through price resistance at 17,695 and the Median Line (gold dotted line) of the Standard Pitchfork (gold P1 through P3) would suggest that maybe a sustainable low is in place.
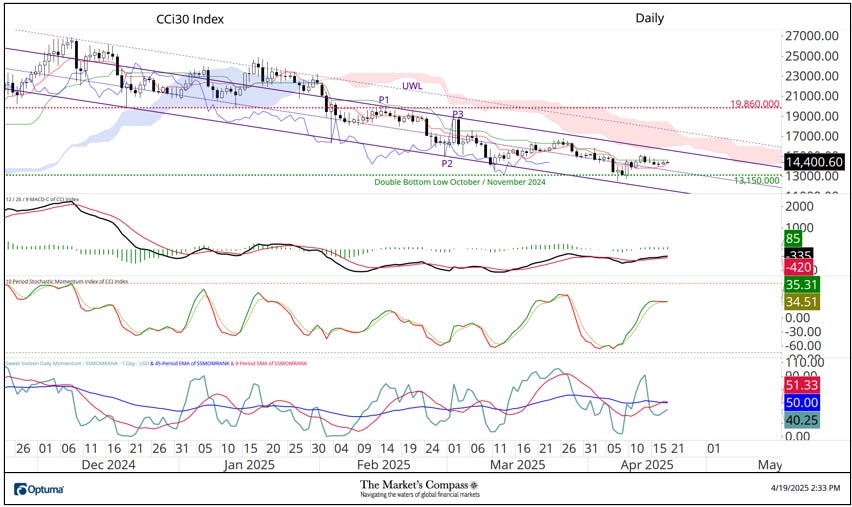
The Daily Chart of the CCi30 Index is as inconclusive as the Weekly Chart. All three secondary indicators are nothing more than mushy (not a bone fide technical term I know). The bane of every market technician’s existence is that, every once in a while one has to wait and watch. Repeating myself (once again), only a rally above the Upper Parallel (solid violet line) and the Cloud would suggest that the correction from the December highs may have run its course.
Most charting software offers some form of RRG charts, but nothing comes close to Optuma’s, and I urge readers to utilize them on a daily basis. The following links are an introduction and an in-depth tutorial on RRG Charts…
https://www.optuma.com/videos/introduction-to-rrg/
https://www.optuma.com/videos/optuma-webinar-2-rrgs/
To receive a 30-day trial of Optuma charting software go to…
An in-depth comprehensive lesson on Pitchforks and analysis as well as a basic tutorial on the Tools of Technical Analysis is available on my website…


